PV column
consulting
2025/10/21
OECD Consumer price and inflation rates around the world (August 2025)
Solar power generation is the most cost-competitive source of electricity, but in Japan, approximately 70% of power generation is based on fossil fuel-based thermal power. Compared to crude oil and natural gas prices around 2000, current prices are roughly three times higher (in dollar terms), and when converted to Japanese yen due to the weak yen, they are nearly four times higher.
Recently, living costs in Japan have been rising, and we’re likely seeing more and more news about rising prices overseas. The Organization for Economic Co-operation and Development (OECD), which has 38 member countries including Japan, publishes statistical data on inflation rates and consumer price trends within its member countries.
In this column, we will introduce the “Consumer prices index (August 2025)” report released by the OECD on October 6, 2025.
**********
OECD headline inflation stable at 4.1% in August 2025 despite rising food and energy prices
Year-on-year headline inflation in the OECD, as measured by the Consumer Price Index (CPI), remained stable at 4.1% in August 2025, having hovered around this rate since March.
Statistical release: 6 October 2025
Available in:
Download in PDF (data tables included)
Year-on-year headline inflation in the OECD, as measured by the Consumer Price Index (CPI), remained stable at 4.1% in August 2025 (Table 1 and Figure 3), having hovered around this rate since March. In August, it rose in 15 of the 38 OECD countries, declined in 13, and was stable or broadly stable in the remaining 10. Costa Rica fell further into deflation in August and inflation remained close to zero in Switzerland. Inflation was above 5.0% in Colombia and Estonia, and above 30% in Türkiye.
Year-on-year food inflation in the OECD rose to 5.0% in August, up from 4.5% in July, reaching its highest level since February 2024 and with marked increases recorded in Türkiye, Korea, and Colombia. In August, food price levels in the OECD were 45.8% higher than in December 2019, before the Covid pandemic, supply chain disruptions and start of the war in Ukraine (Figure 2). This marks the largest cumulative increase among the three main inflation components – core (inflation less food and energy), food, and energy. Prior to this period, it took around 16 years – from May 2003 to late 2019 – for food prices to increase by a similar magnitude. However, food price inflation varied significantly across countries between December 2019 and August 2025: the cumulative increase in food prices over this period was only 6.9% in Switzerland while it reached around 80% in Colombia and Hungary, and more than 790% in Türkiye. Energy inflation in the OECD also rose in August, reaching 0.7%, compared with 0.3% in July, while core inflation edged down slightly to 4.3%.
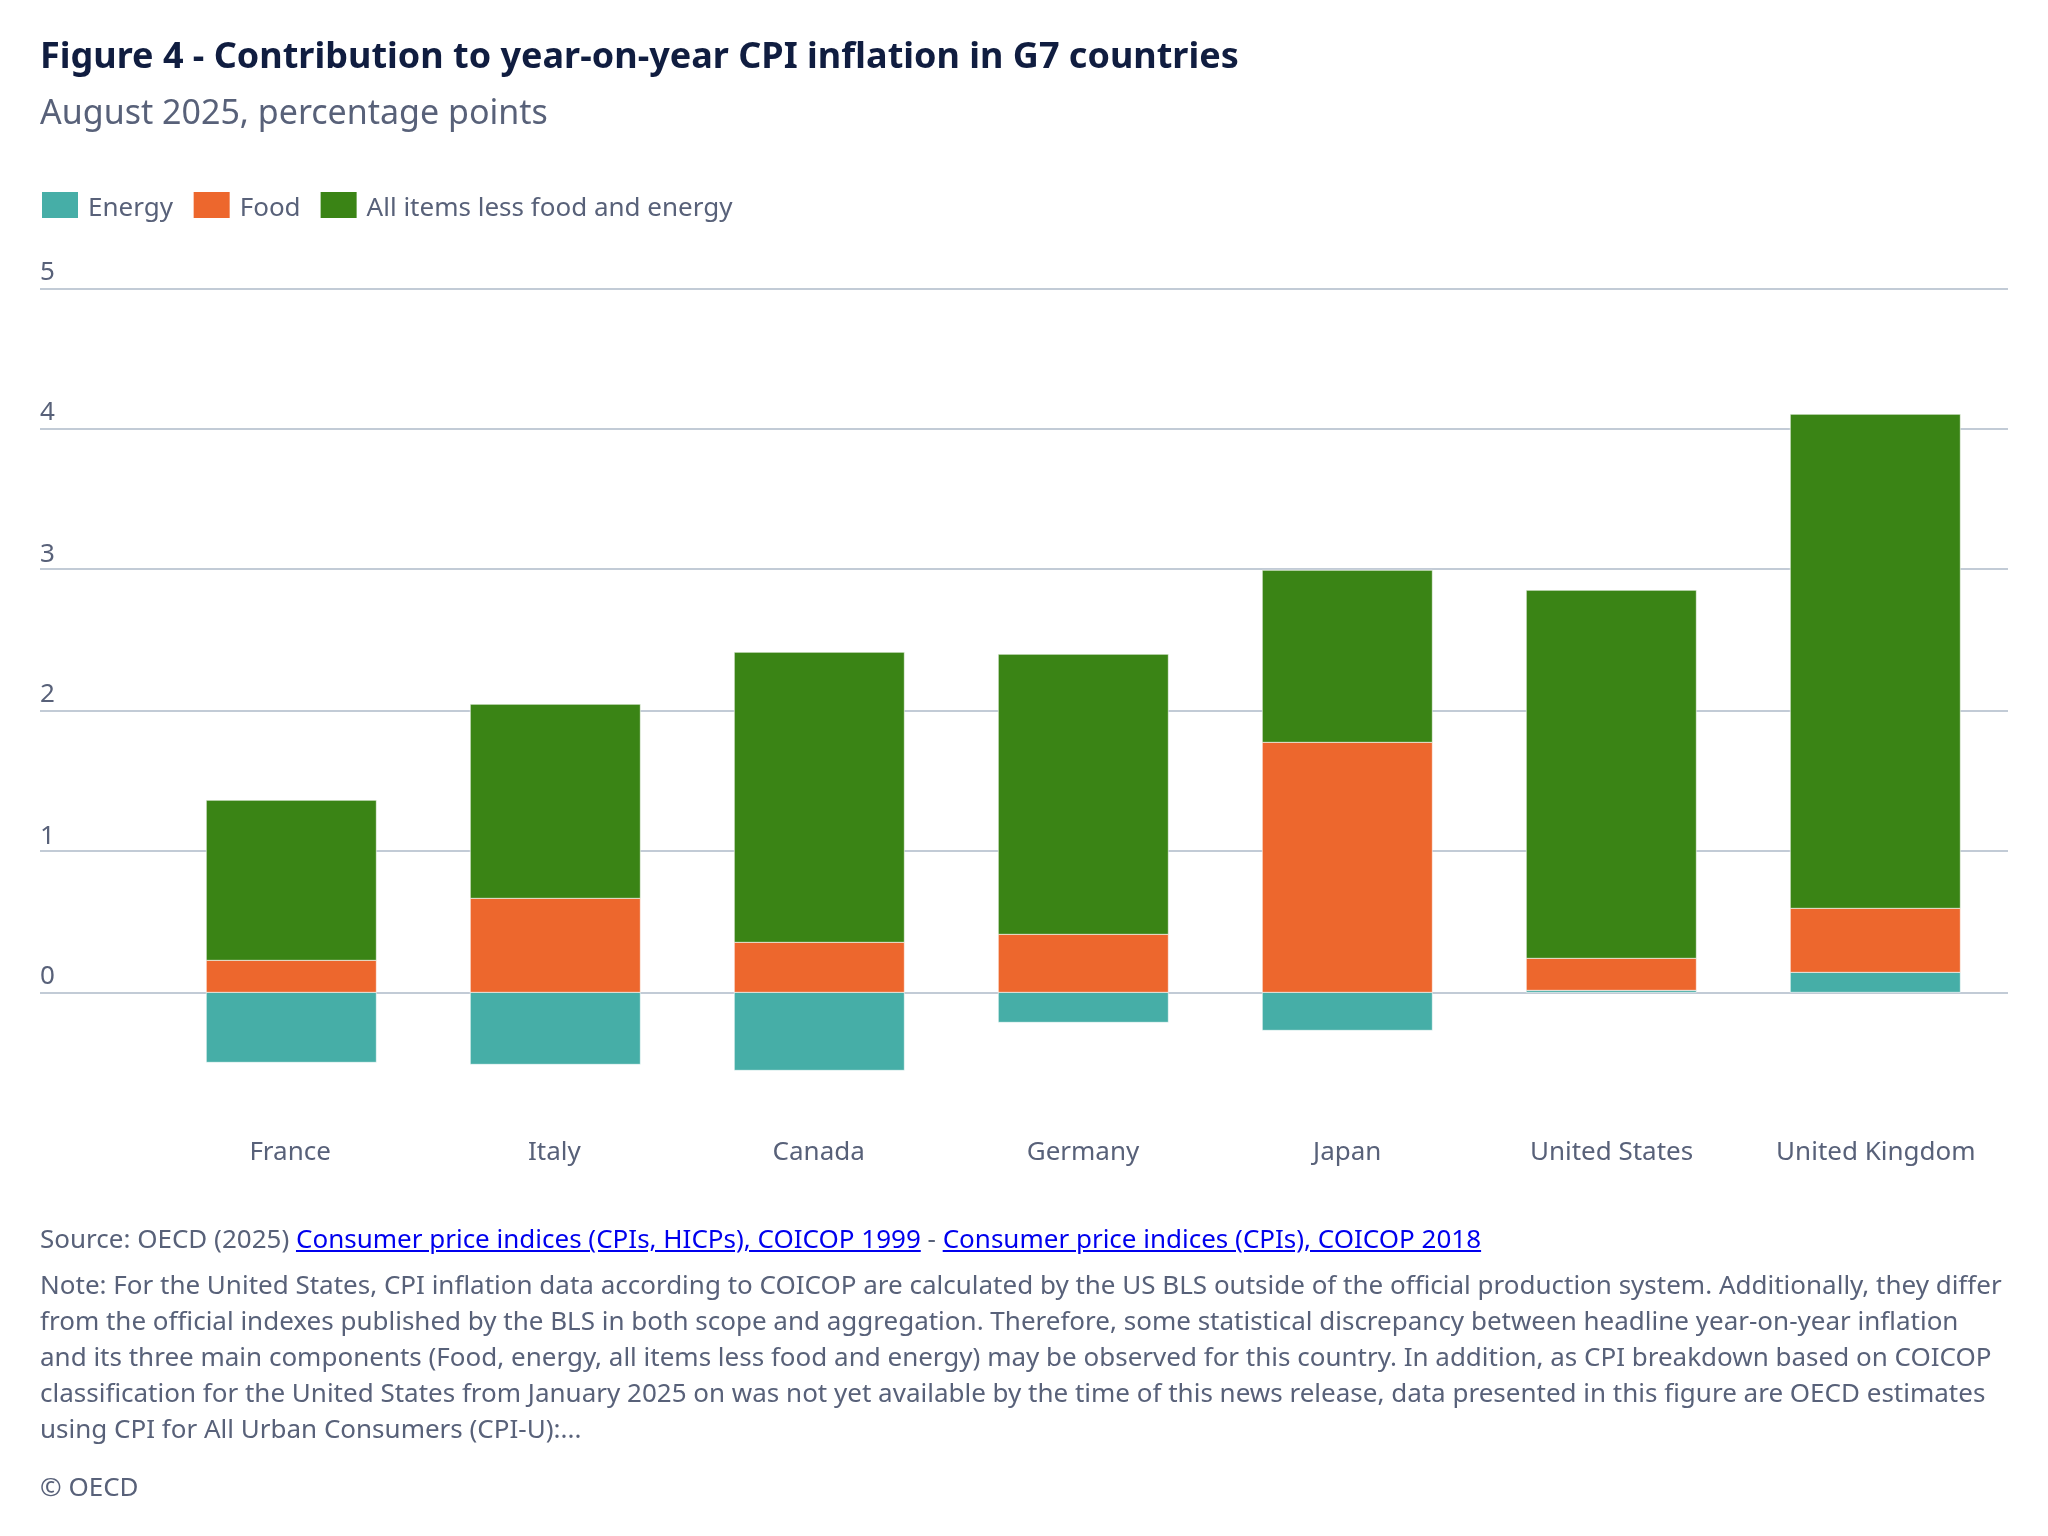
increased by 0.2 p.p. in Canada, Germany, and the United States. By contrast, it fell in Japan, reflecting a decline in food inflation and an even stronger decline in energy inflation. Core inflation remained the main contributor to headline inflation across the G7 except in Japan, where food and energy inflation combined had a larger impact (Figure 4).
In the euro area, year-on-year inflation, as measured by the Harmonised Index of Consumer Prices (HICP), remained stable in August, at 2.0% for the third consecutive month. Food inflation was stable at 3.2%, twice the rate seen in January 2025, while the decline in energy prices slowed. According to Eurostat’s flash estimate, in September 2025, year-on-year headline inflation in the euro area rose to 2.2% as the decline in energy prices slowed again while core inflation is estimated to have remained stable.
In the G20, year-on-year inflation remained broadly stable at 3.7% in August. Headline inflation fell in China, where it was negative at minus 0.4%. It also fell in Argentina (still above 30%) and South Africa, while it rose in India. It was broadly stable in Brazil, Indonesia, and Saudi Arabia (Table 2).
Figure 1 – Consumer prices: All items and all items less food and energy
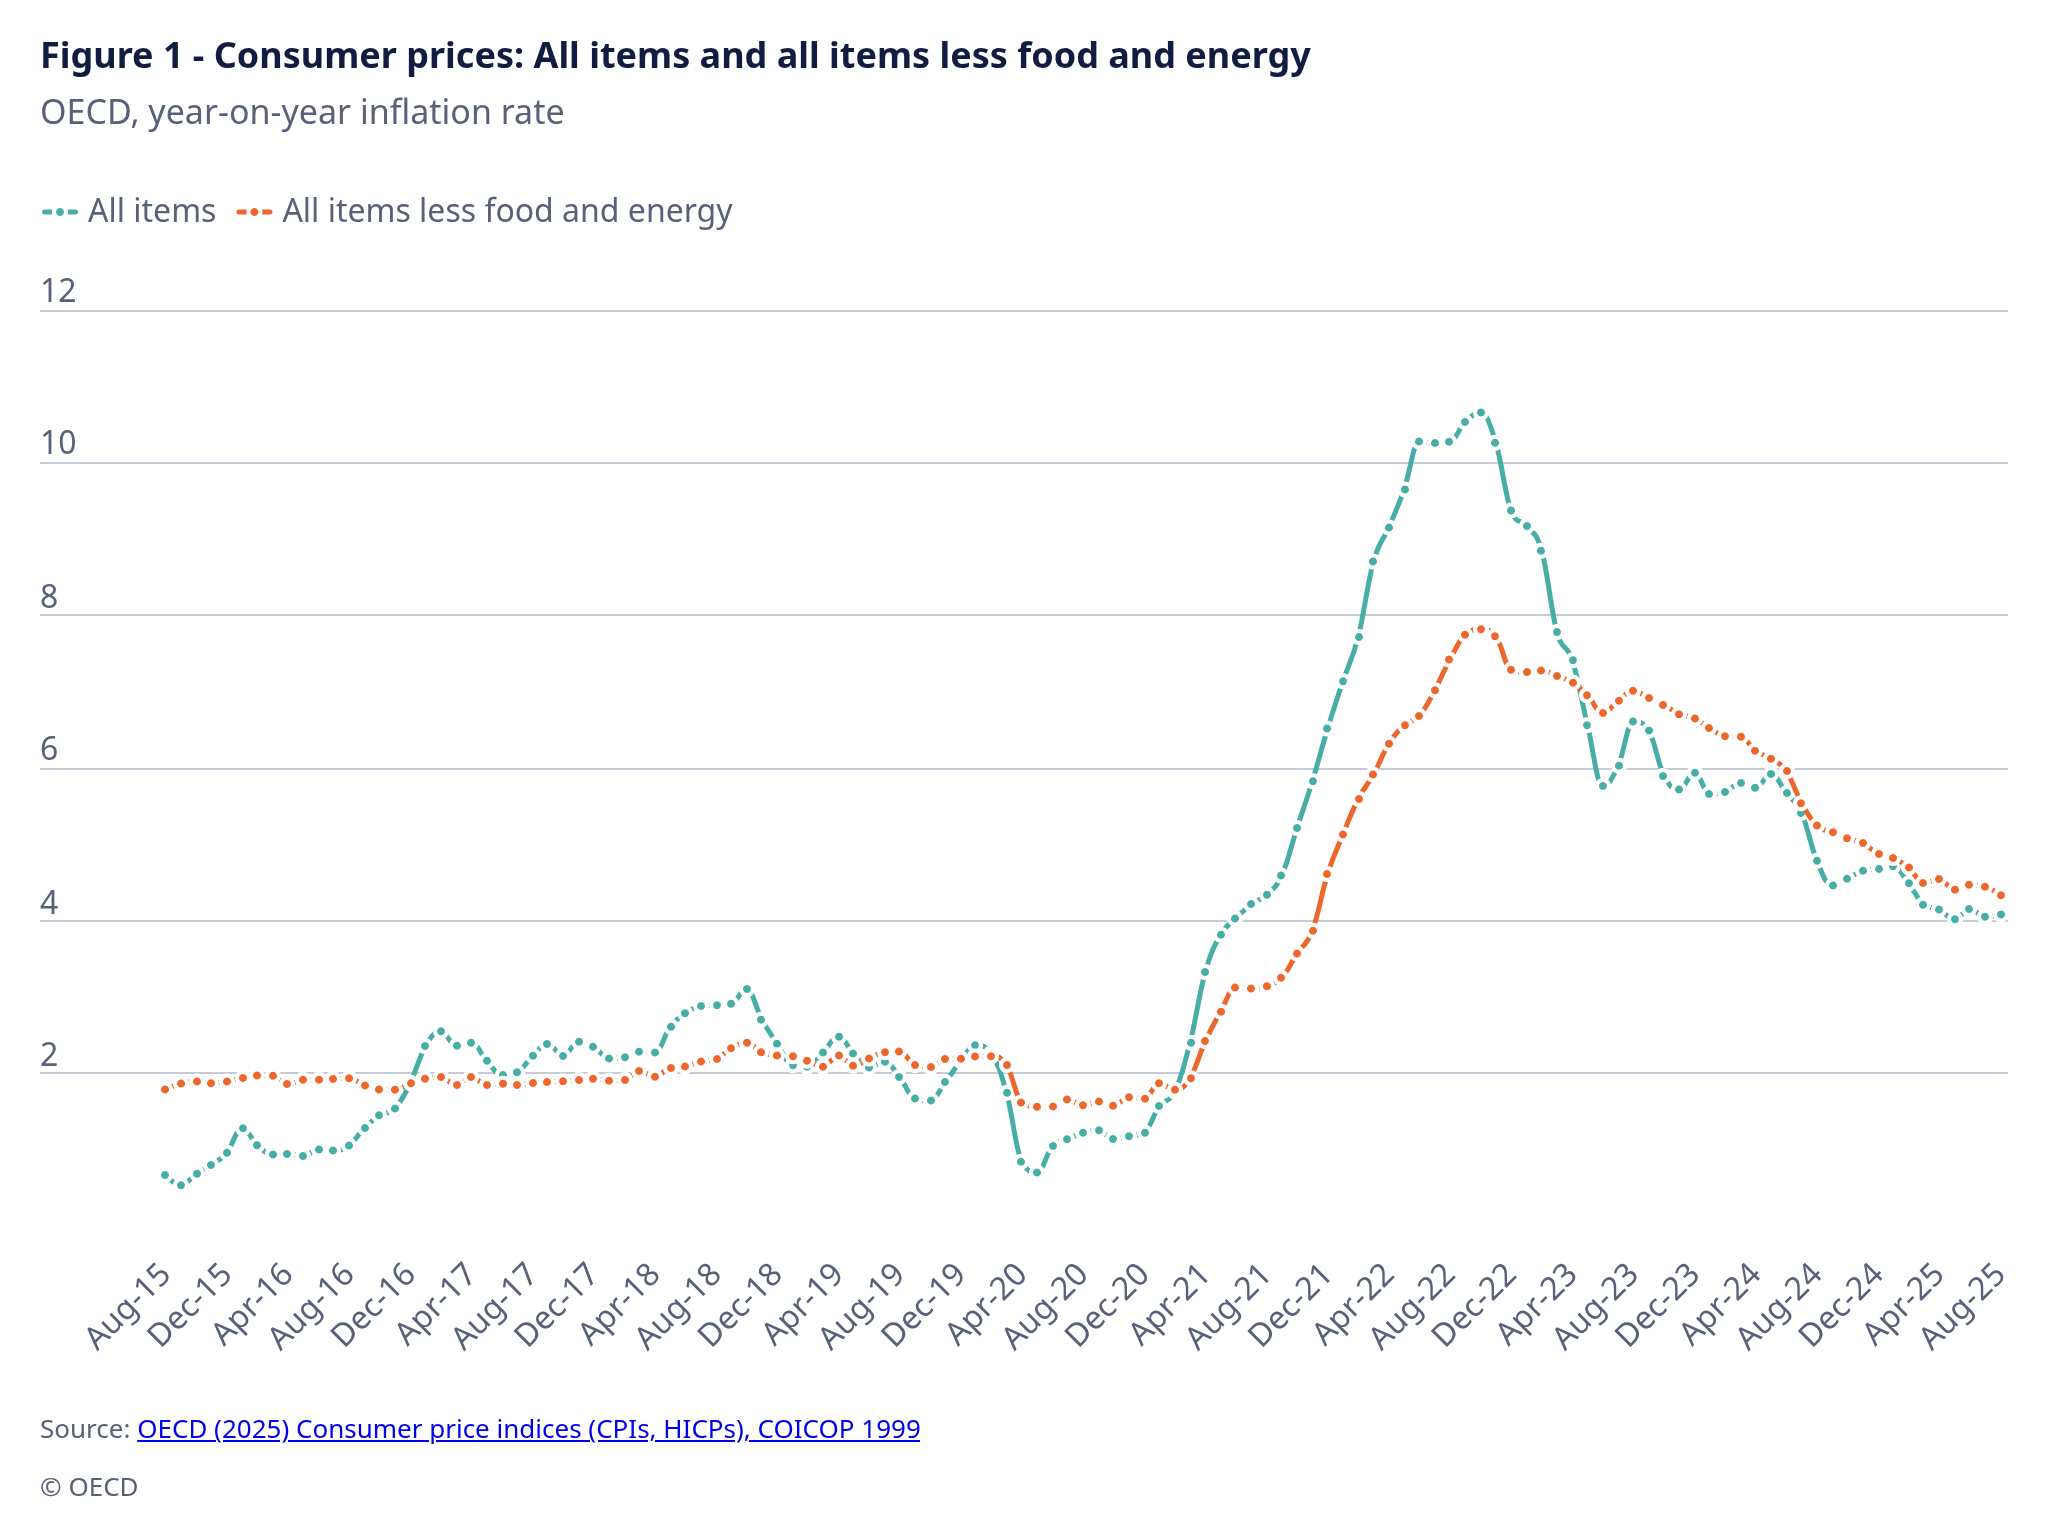
Figure 2 – Consumer price index – All items and components
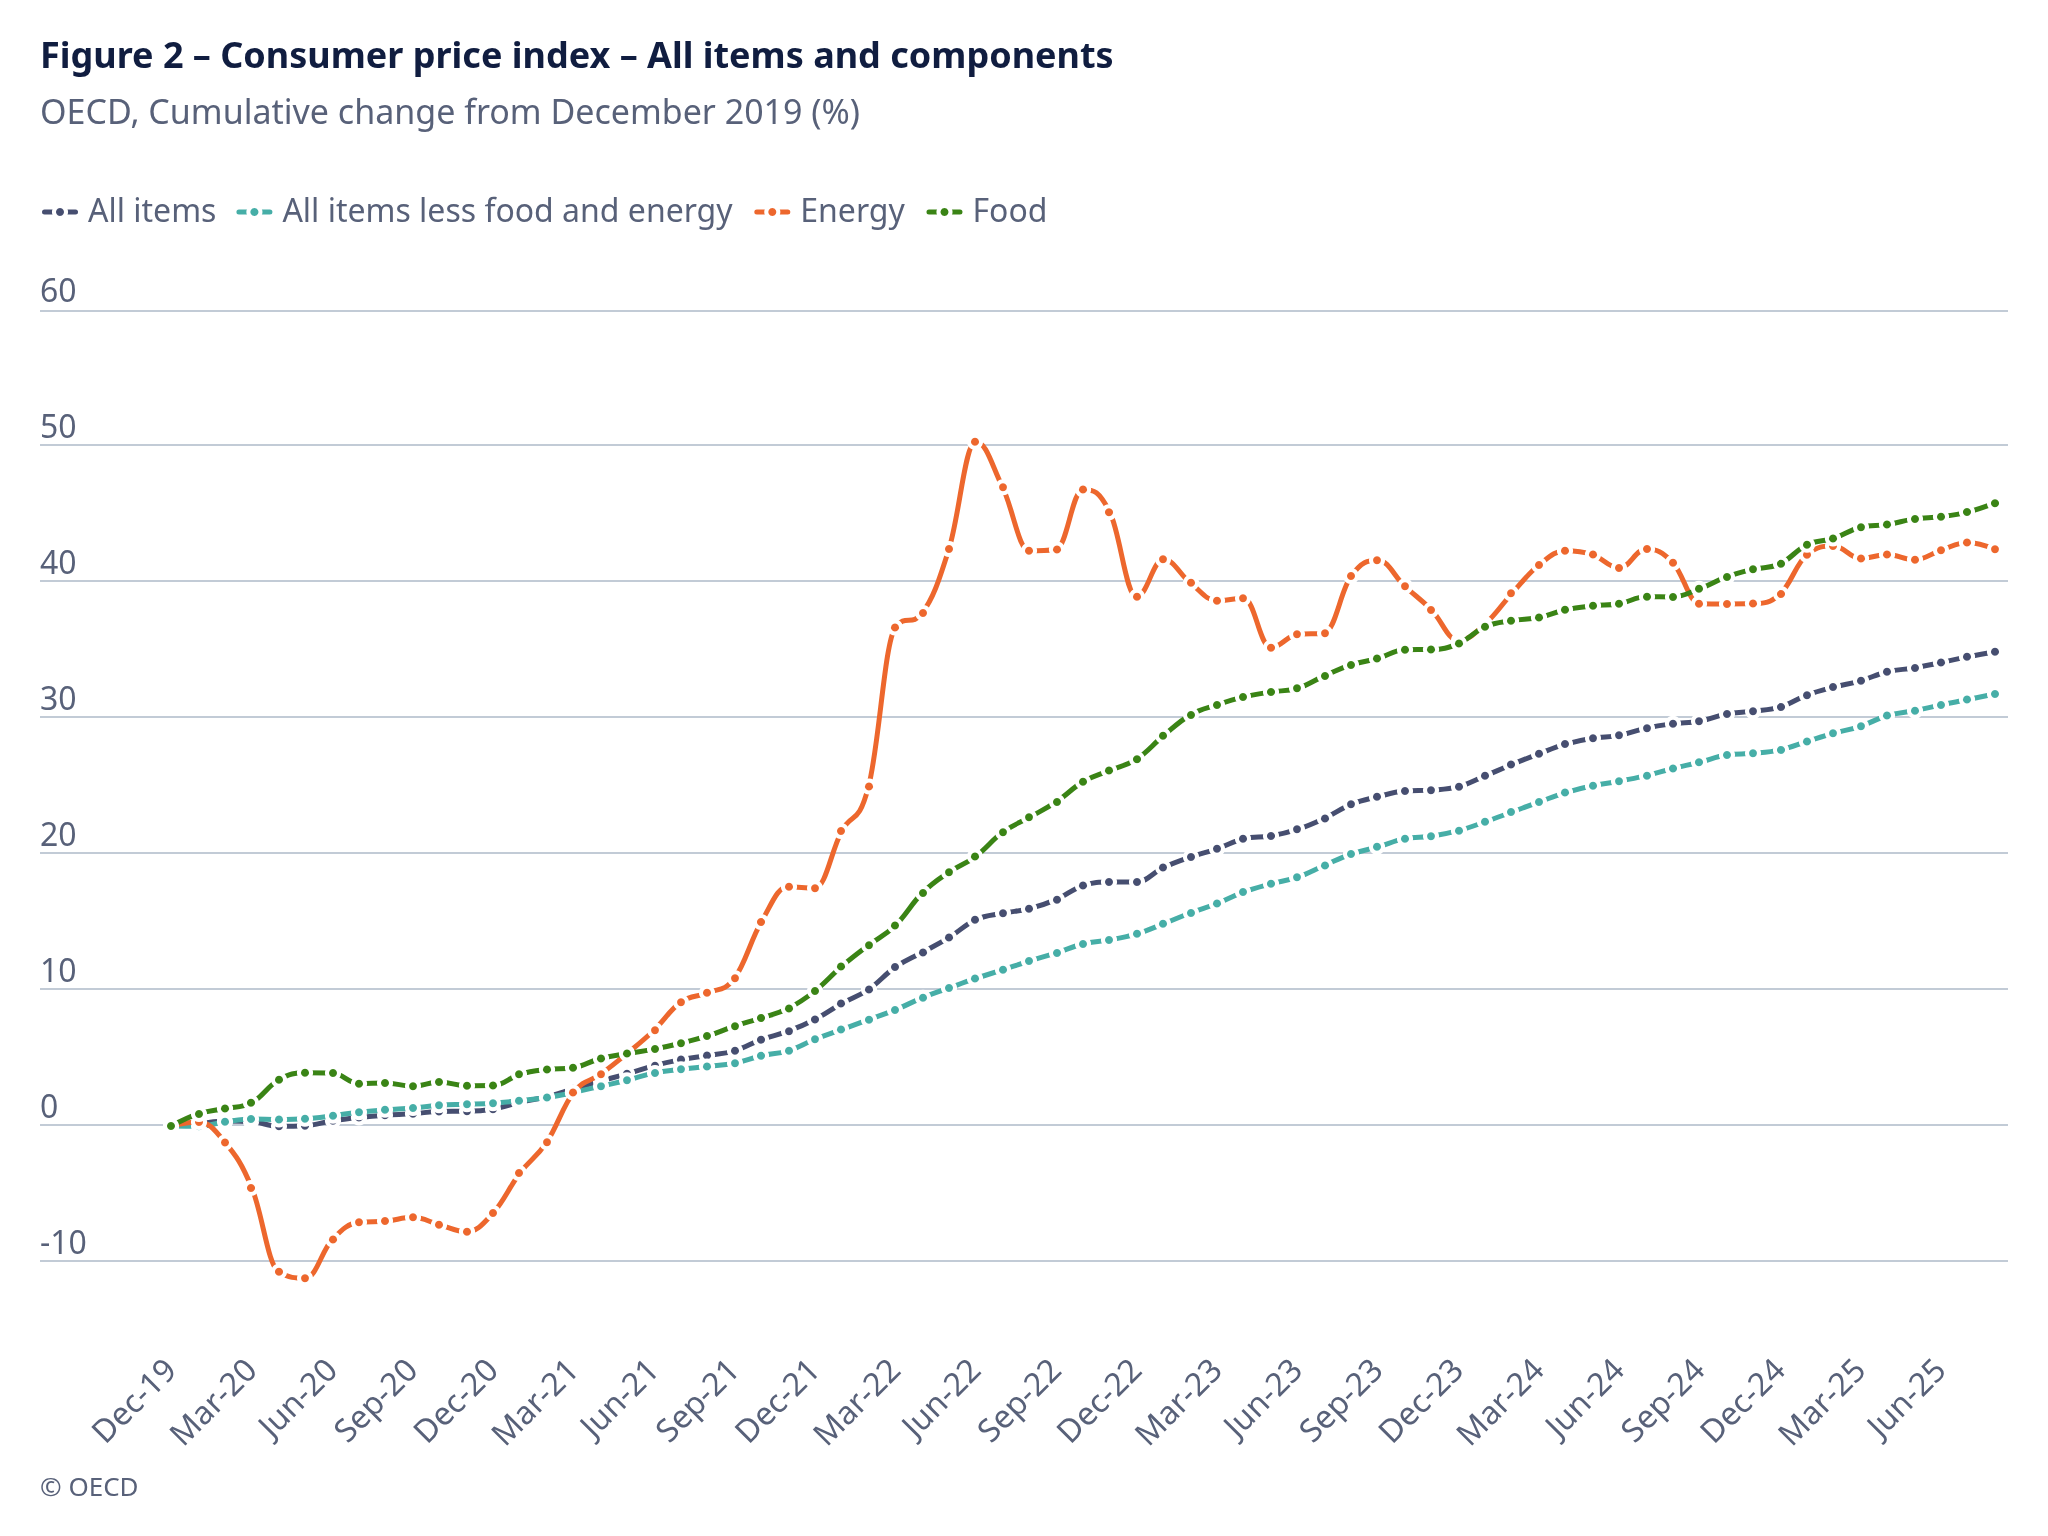
Figure 3 – Consumer prices, G7 economies and OECD – Total inflation and its components
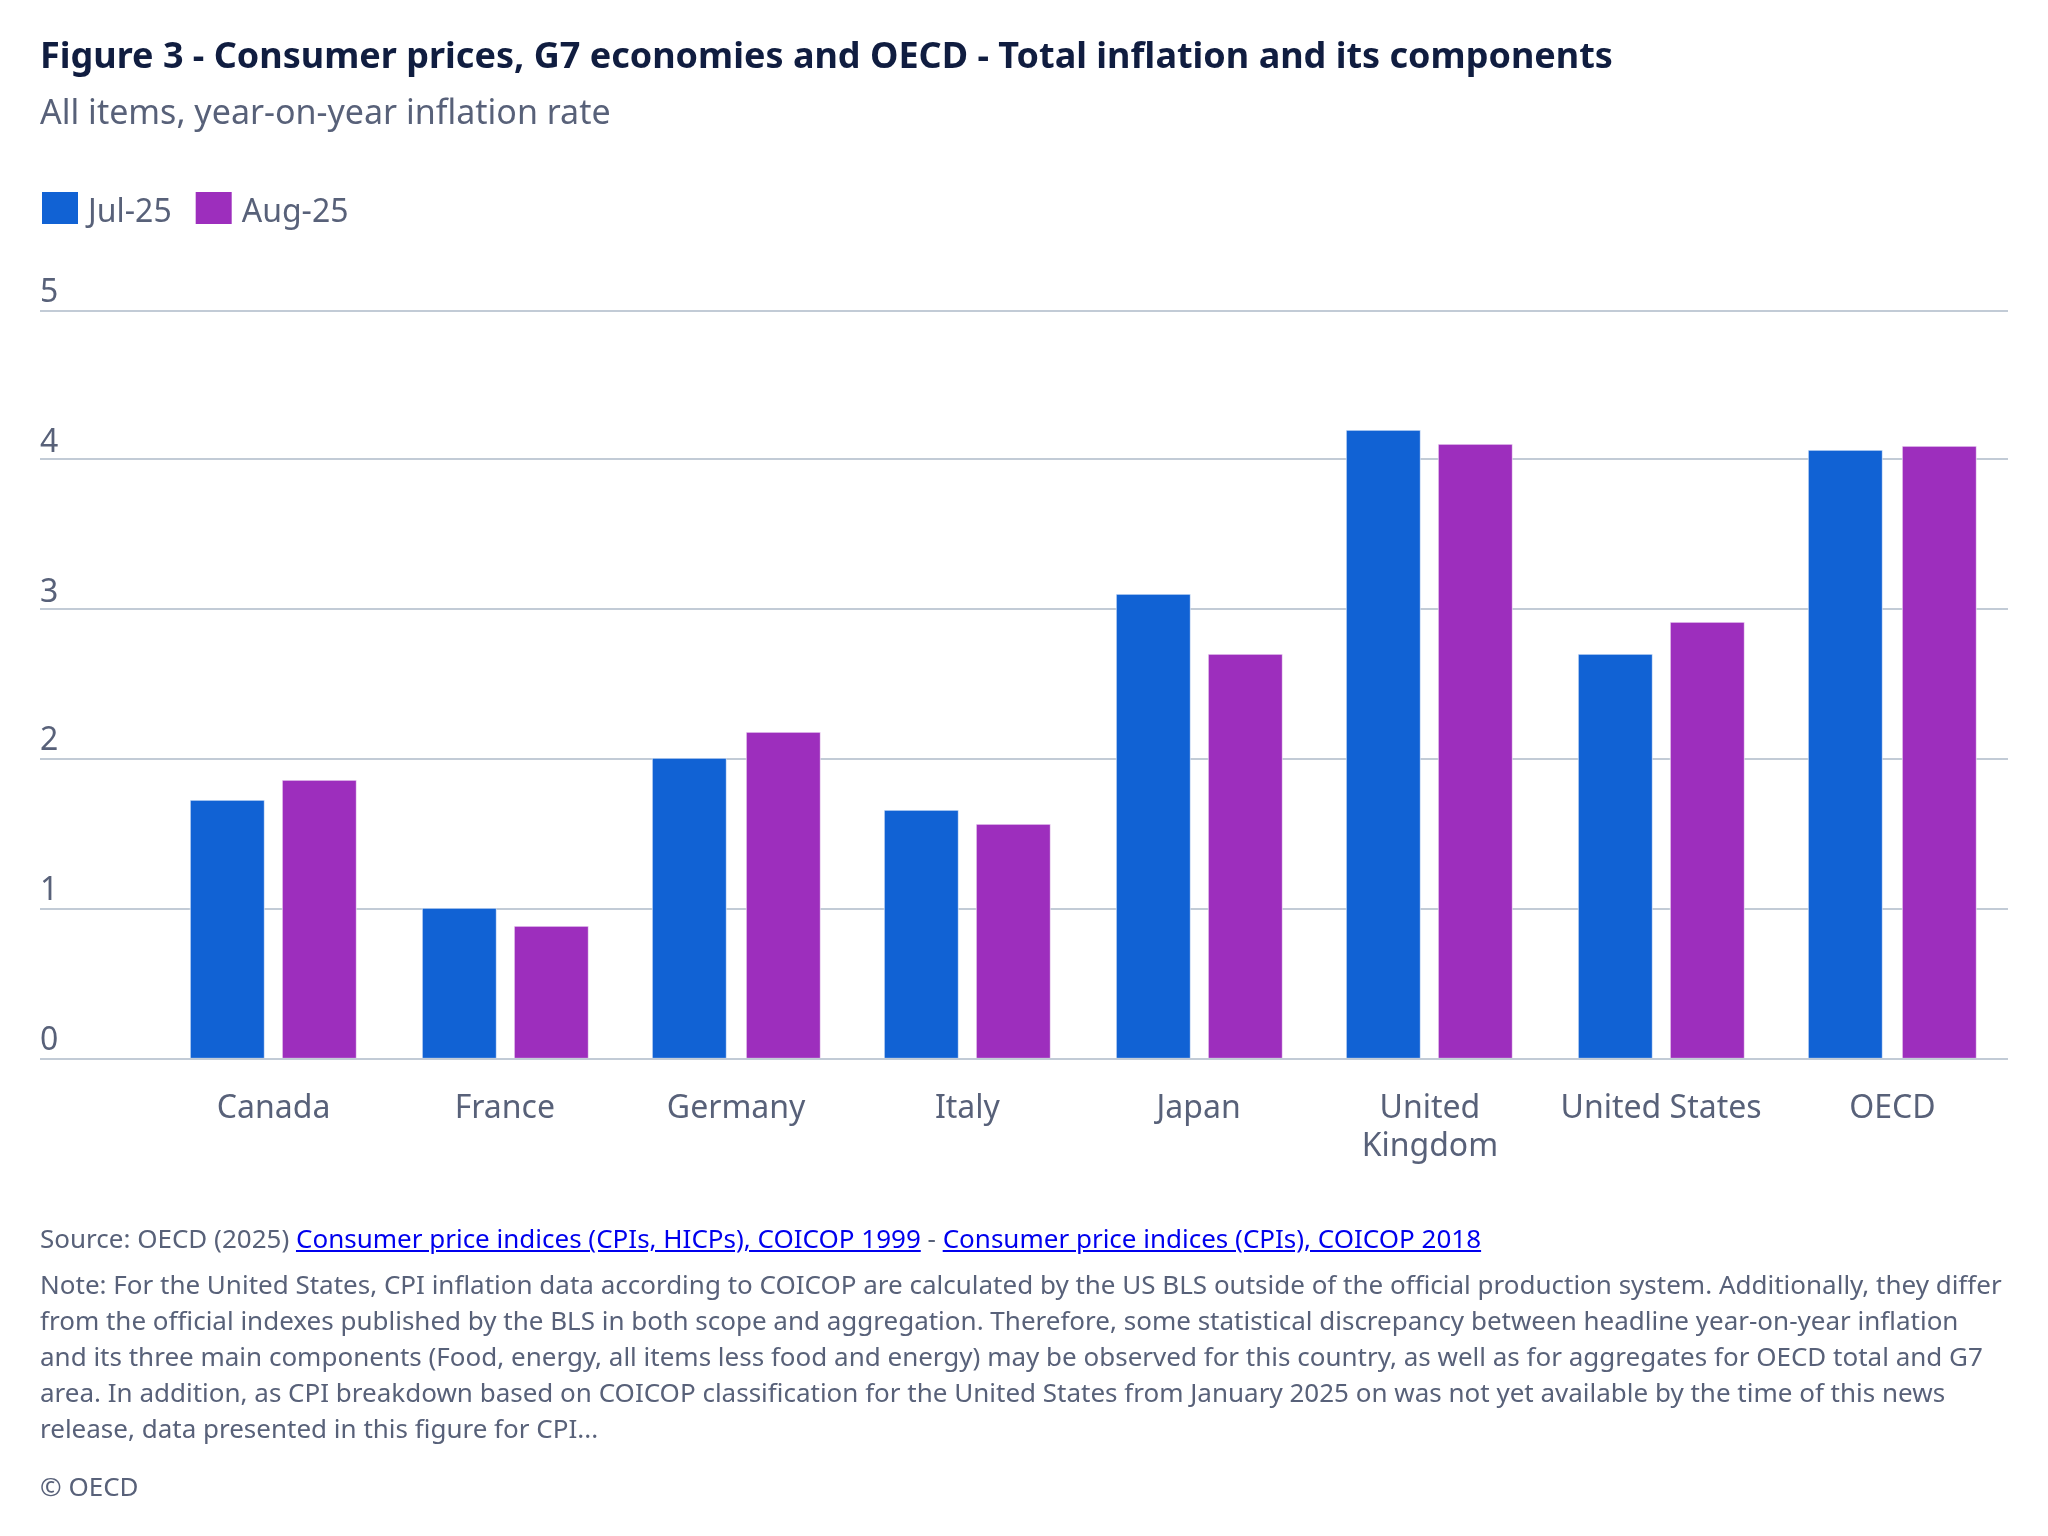
Figure 3 – Consumer prices, G7 economies and OECD – Total inflation and its components
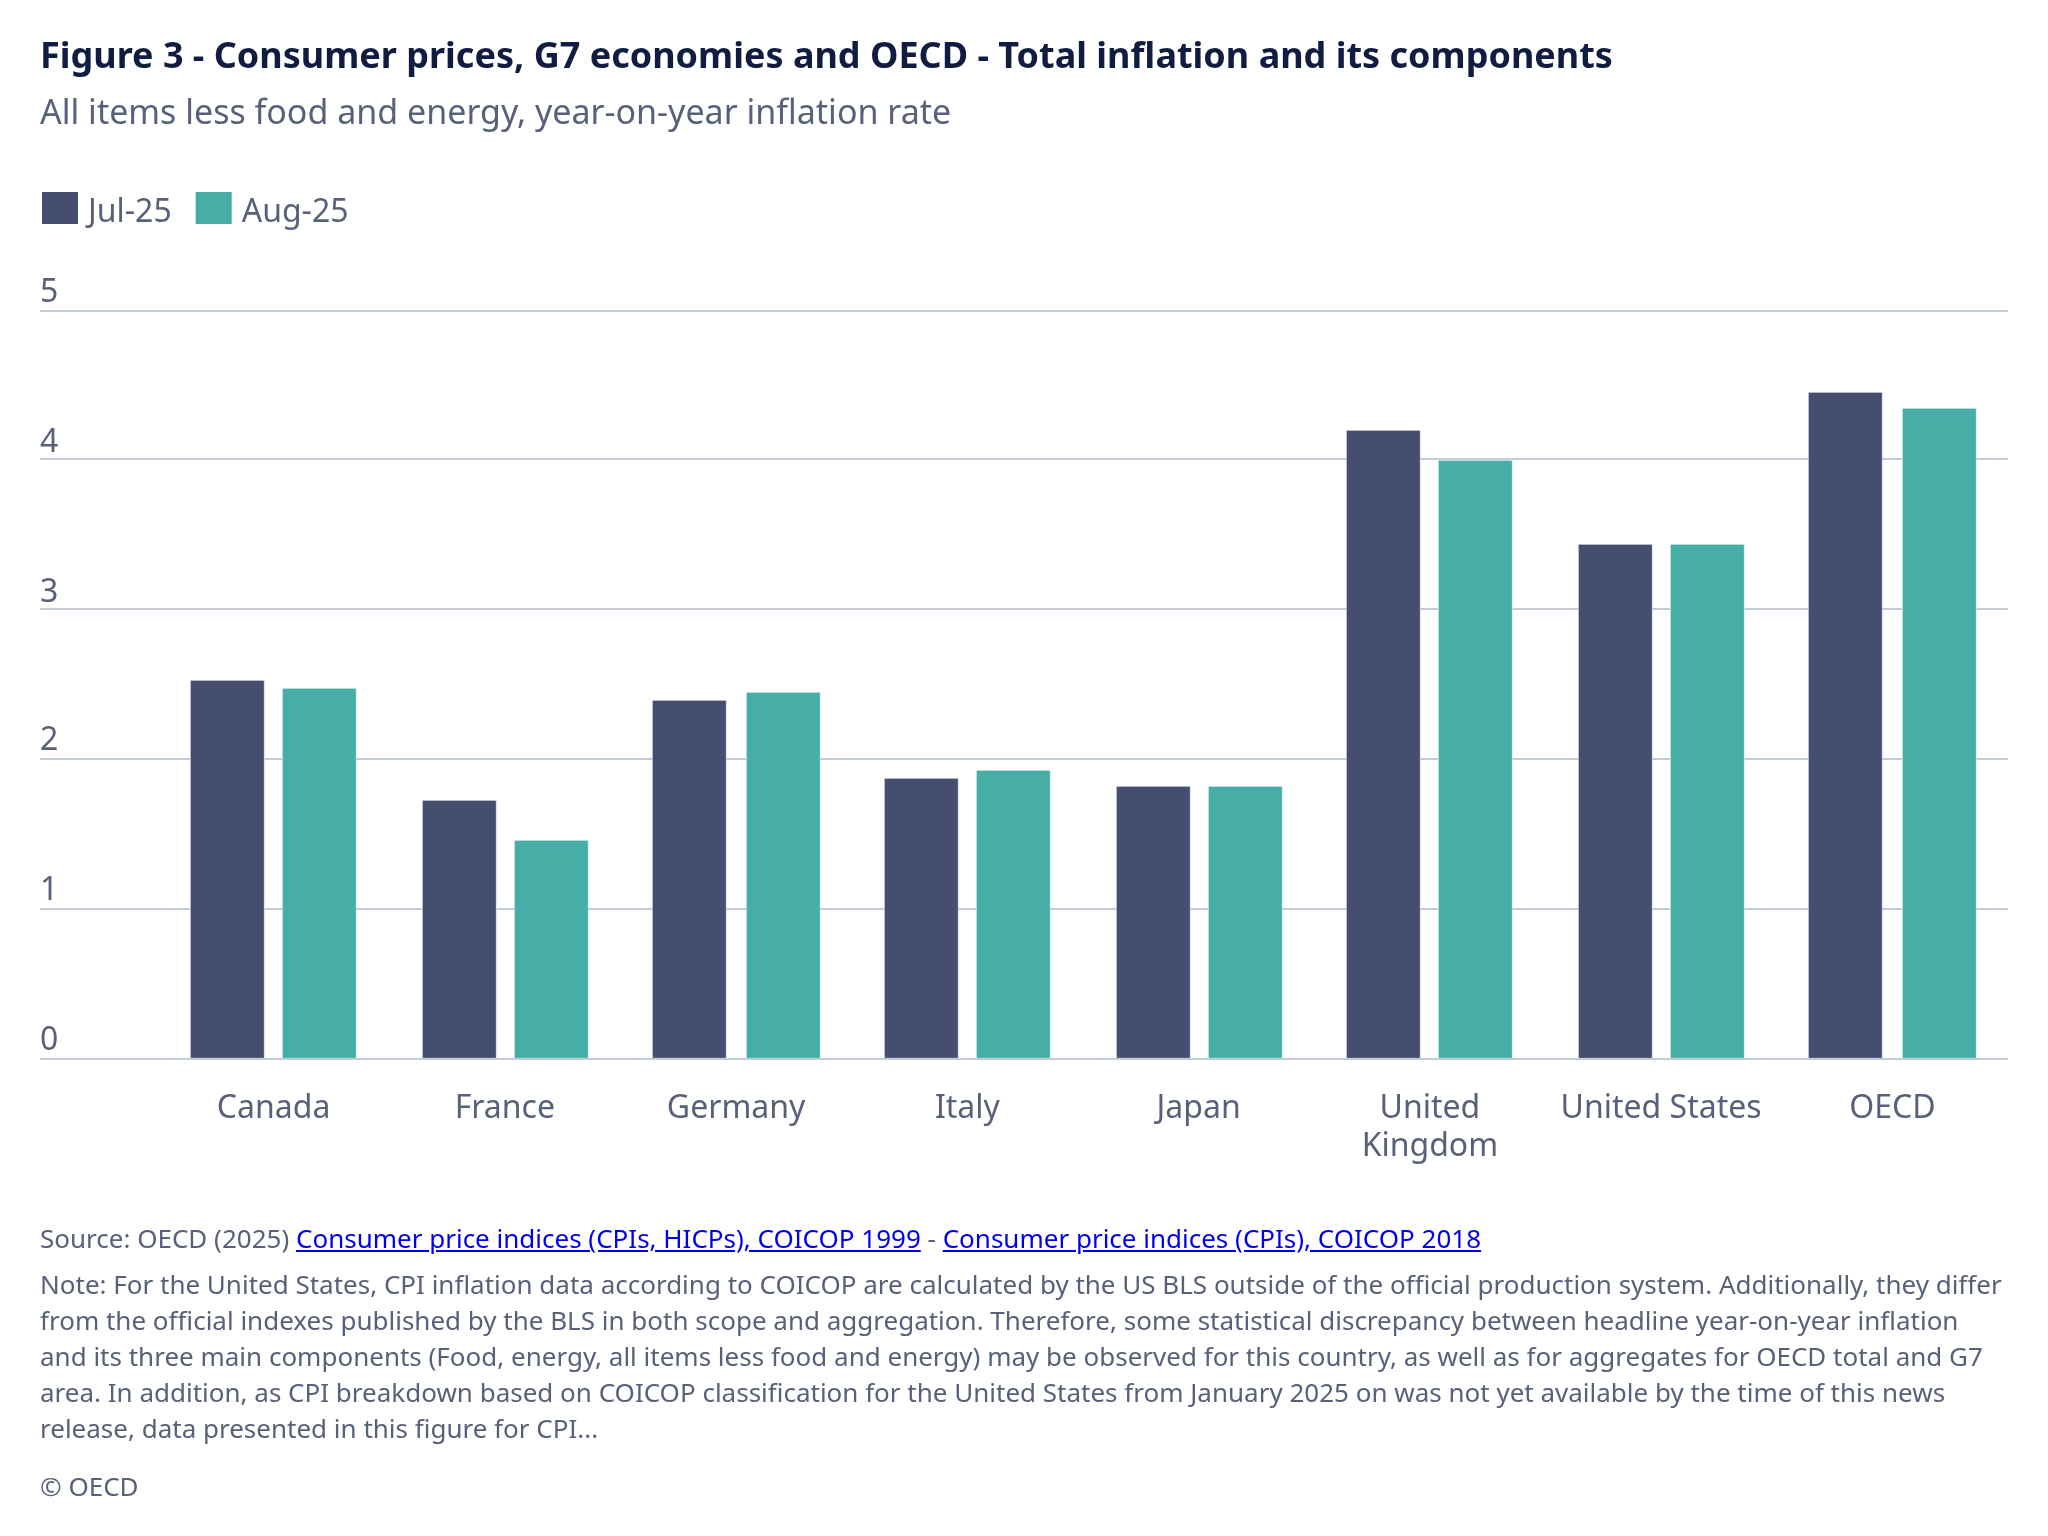
Figure 3 – Consumer prices, G7 economies and OECD – Total inflation and its components
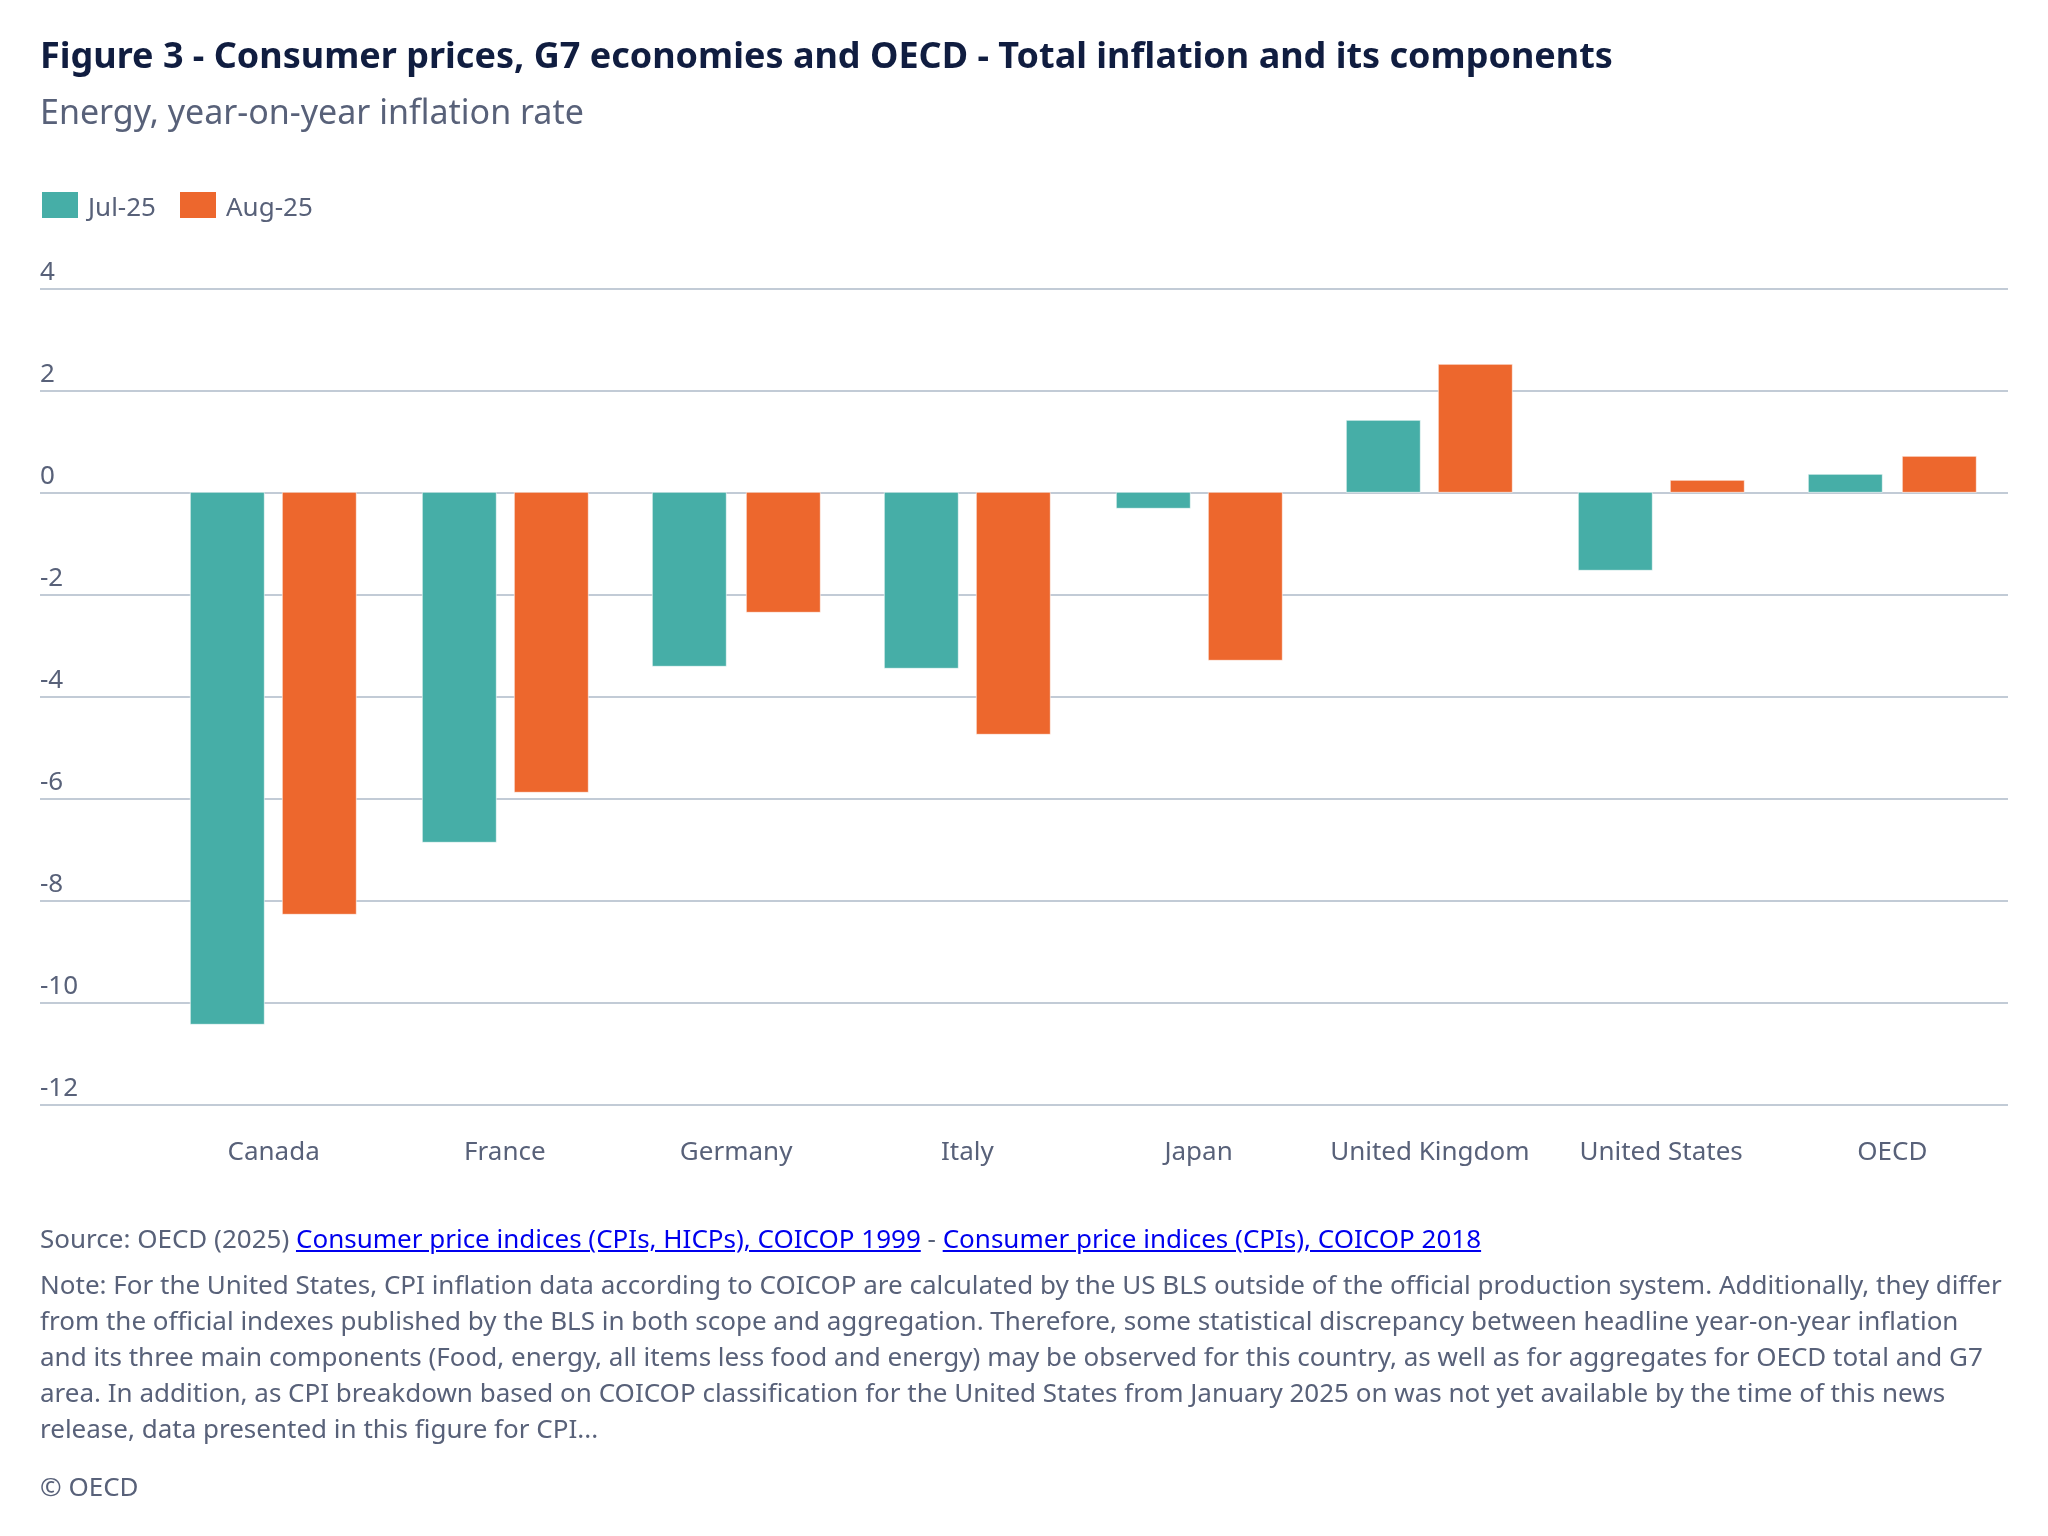
Figure 3 – Consumer prices, G7 economies and OECD – Total inflation and its components
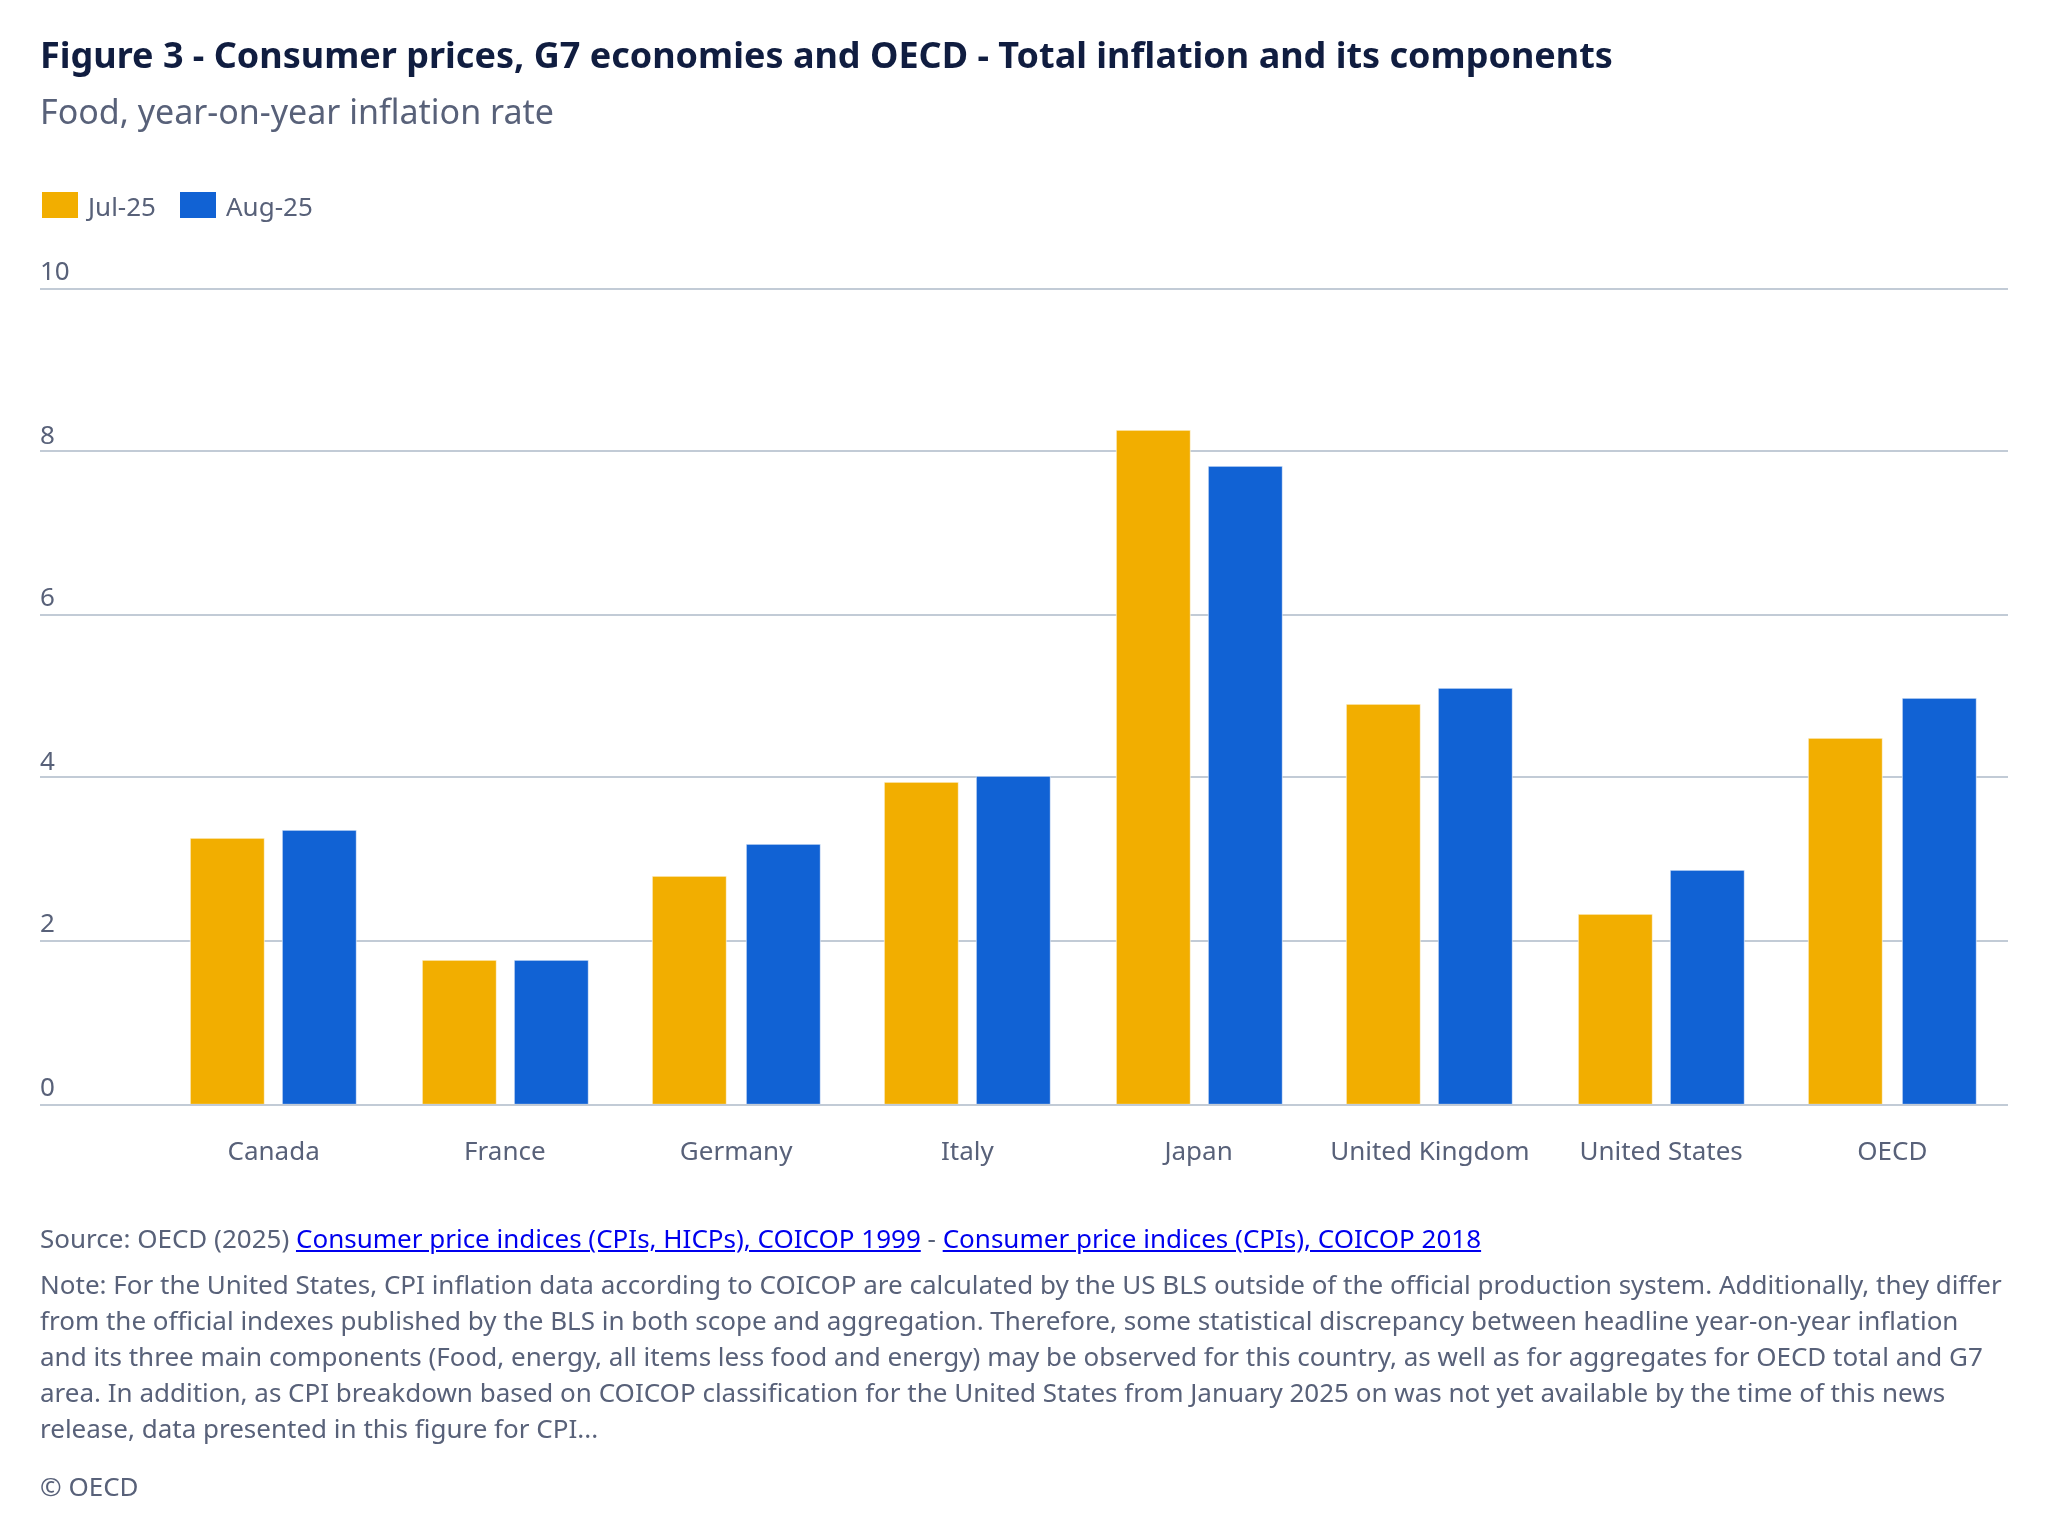
Figure 4 – Contribution to year-on-year CPI inflation in G7 countries
Graphs by country
- OECD countries, contributions to annual CPI inflation by COICOP Division, current month (xlsx)
- OECD countries, contributions to annual CPI inflation, selected components, historical series (xlsx)
- G7 & non-OECD countries, zone aggregates, inflations rates, historical series graphs (xlsx)
Methodology
- OECD Consumer price index: Methodological Notes for OECD CPI News Release (PDF)
- OECD Contributions to annual inflation: OECD calculation of contributions to overall annual inflation (PDF)
**********
While Japan’s energy costs have decreased slightly, food prices have increased by approximately 8%, the largest among G7 countries. According to Japan’s 2024 agricultural, forestry, and fishery product export and import statistics (Japanese version only), annual exports of agricultural, forestry, and fishery products totaled approximately 1.4092 trillion yen, while imports totaled approximately 13.4049 trillion yen, resulting in an import surplus of approximately 11.9957 trillion yen. (Importers: 1st place: United States (2.2329 trillion yen), 2nd place: China (1.8023 trillion yen))
As a country that relies on fossil fuels for 70% of its energy needs, we believe it is important to make effective use of solar power, the most cost-competitive power source and independent of raw material imports, as a means of increasing energy self-sufficiency.
Acknowledgments: We would like to take this opportunity to thank the source OECD for these statics and data.