PV column
energy
2024/01/21
Transition in output control in Kyusyu region
The expansion of the areas subject to output control of renewable energies including photovoltaic power plants, and the amount of output control have been increasing year by year because the scale with the grid and regulated power cannot keep up with the pace of the increase in the amount of photovoltaic power plants installed.
Organization for Cross-regional Coordination of Transmission Operators, JAPAN (OCCTO) has published the results of its verification of the output control of renewable energy power generation facilities.
References: Results of Verification on Output Control of Renewable Energy Generation Facilities|Organization for Cross-regional Coordination of Transmission Operators, JAPAN (OCCTO) (Japanese version only)
In this column, we summarize the transition in the mainland Kyushu region with regard to output control in the Kyushu region, which has been a hot topic from early spring to summer of 2023.
Graph 1. Example of output control at a PV plant in Kagoshima Pref. (April 23, 2023)
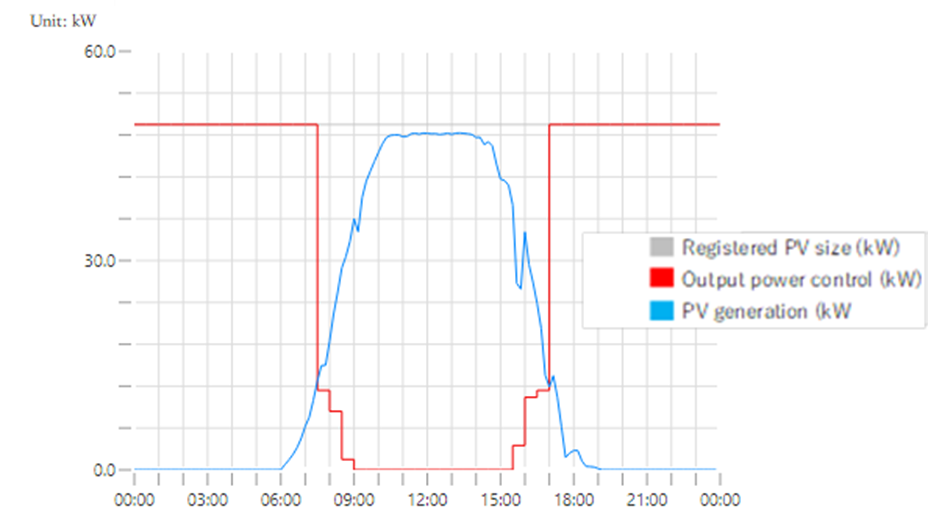
A. Number of output control has been implemented for renewable plants in mainland
First half of FY2023 (April 1 – September 30): 60 times FY2022: 80 times; 14-15 times per power plant (after taking proxy control into account). Low-voltage to extra high-voltage plant. FY2021: 82 times; 27-28 times (offline control) and 22-25 times (online control) per power plant. High-voltage to extra high-voltage plant. 35 times (unlimited and unguaranteed) Low-voltage to extra high-voltage plant. FY2020: 60 times; 21-22 times (offline) and 6-7 times (online) per power plant. High-voltage to extra high-voltage plant. 6-7 times (specified rule) Low-voltage to extra high-voltage plant. FY 2019: 74 times; 23-24 times per power plant (offline) High-voltage to extra high-voltage plant. 15-16 times (online). extra high voltage plant. 15-16 times (specified rule) Low to extra high voltage plant. 15-16 times (specified rule) Low to extra high voltage plant. FY 2018 (Oct. 13-March 31): 26 times; 5-6 times per power plant (old rules) high voltage to extra high voltage. 5-6 times (specified rules) low voltage to extra high voltage. 5-6 times (specified rules) low voltage to extra high voltage.
B. Amount of renewable energy output control to renewable plants in mainland Kyushu:
First half of FY2023 (April 1-September 30): 250.22 GW, or 4.17 GW per times. FY2022: 123.3 GW, or 1.54 GW per times.FY2021: 119.8 GW, or 1.46 GW per times. FY2020: 69.85 GW, or 1.16 GW per times. FY2019: 83.23 GW, or 1.12 GW per times. FY2018 (October 13-March 31): 26.98 GW, or 1.04 GW per times.
In mainland Kyushu, renewable energy output control was implemented for the first time on Saturday, October 13, 2018. In fiscal year 2018 (October 13, 2018 to March 31, 2019), the number of times it was implemented was 26, the amount of output control was 26.98 GW, and the average output control per control was 1.04 GW. In the first half of this fiscal year (April 1, 2023 to September 30, 2023), the number of times implemented was 60 times, the amount of output control was 250.22 GW, and the average amount of output control per time was 4.17 GW.
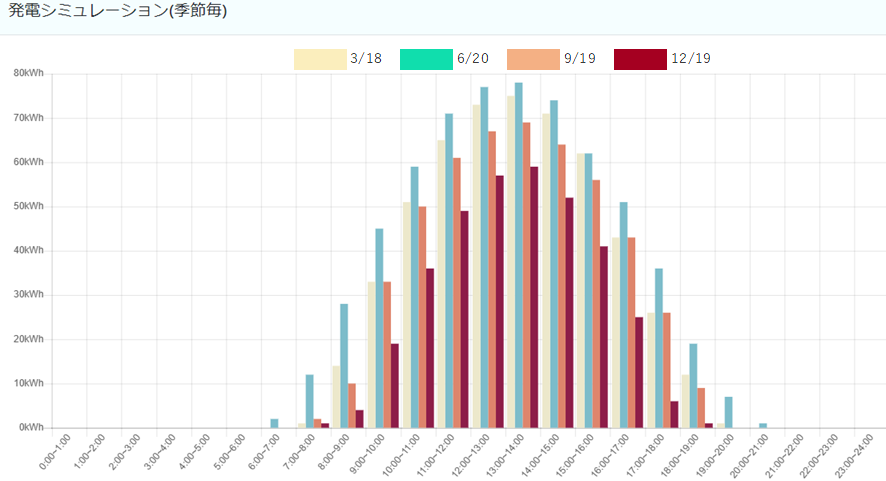
Graph 2. Power generation of 100kW PV plant in Fukuoka by each season and each hour:
C. Difference between online and offline control:
We have prepared a list of the announcement by Kyushu Electric Power Transmission and Distribution Company regarding the settlement ratio for online proxy control and the amount of electricity generated (PV plant size 100 kW) in the relevant month in mainland Kyushu (prefectural capitals of each prefecture).
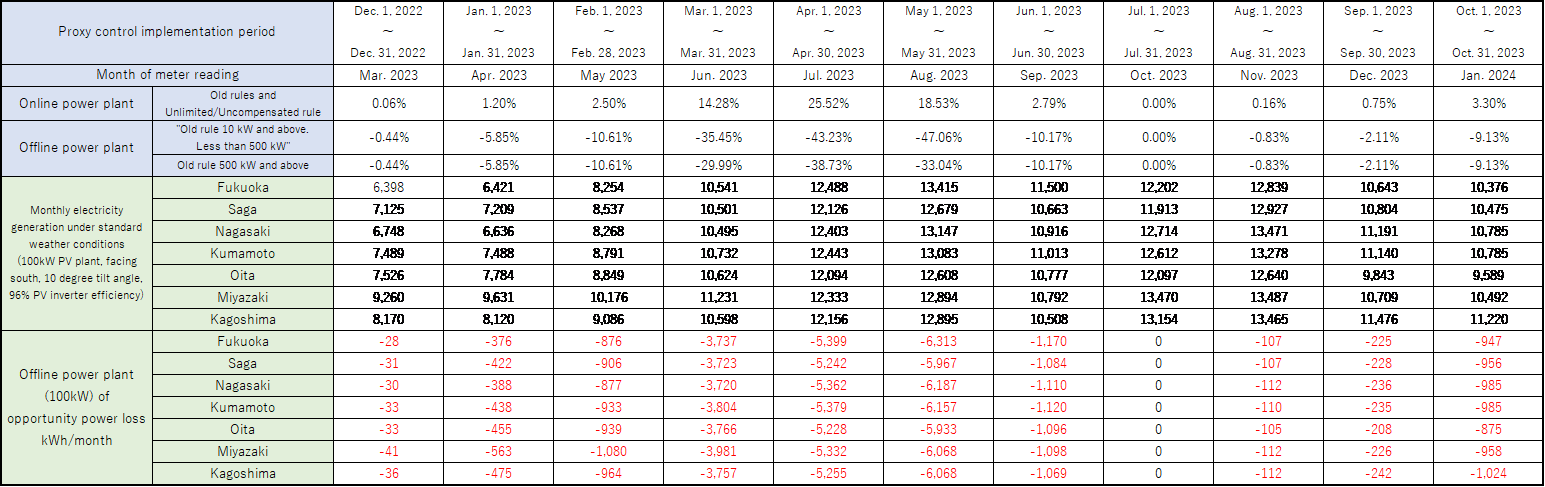
Note: Estimated by our simulation of the amount of electricity generation in Kyushu
The opportunity loss is approximately 16% of the PV power generation during the relevant period (11 months).
Example: For a 300kW PV plant in Miyazaki Pref. with a FIT price of 36 yen/kWh, the opportunity loss for the above period (11 months) would be -58,374kWh, or approx. 2.1 million yen without tax.
There are seven types of suppression and adjustment based on the priority feed-in rule.
- output control of thermal power plants (Power Sources I and II thermal power)
- Pumping operation of pumped storage plants (8 plants, total pumping power -2.532GW)
- Charging of energy storage system (1 location, max. charging power -50,000 kW)
- Output control of thermal power plants including biomass co-firing power sources (Power Source III thermal power)
- Long-period wide-area frequency adjustment
- Output control of biomass-fired power plants
- Output control of biomass from local resources
Reference: Basic Approach to Verification of Output Suppression of Renewable Energy Generation Facilities (Natural Variable Power Sources) from Organization for Cross-regional Coordination of Transmission Operators, JAPAN (OCCTO), November 29, 2023 (Japanese version only)
As mentioned above, even with the use of many suppression and adjustment measures, an increase in the frequency and scale of output suppression has become inevitable, not only because of the rapid increase in the installation of feed-in tariff type PV plants, but also because of the recent increase in the installation of self-consumption PV systems.
By the recent increase in the size and cost reduction of energy storage systems, it is expected that energy storage systems for the grid will be installed in Japan like overseas. In order to promote the installation of renewable energy facilities, we think that it is equally important to develop models that utilize renewable energy without placing a burden on the grid.