PV column
consulting
2024/01/11
Population Prospects by Region in Japan and the World
In December 2023, the National Institute of Population and Social Security Research released “Future Population Projections by Region in Japan (2023 estimates), Japanese version only” regarding population, which is one of the bases for energy consumption and economic trends.
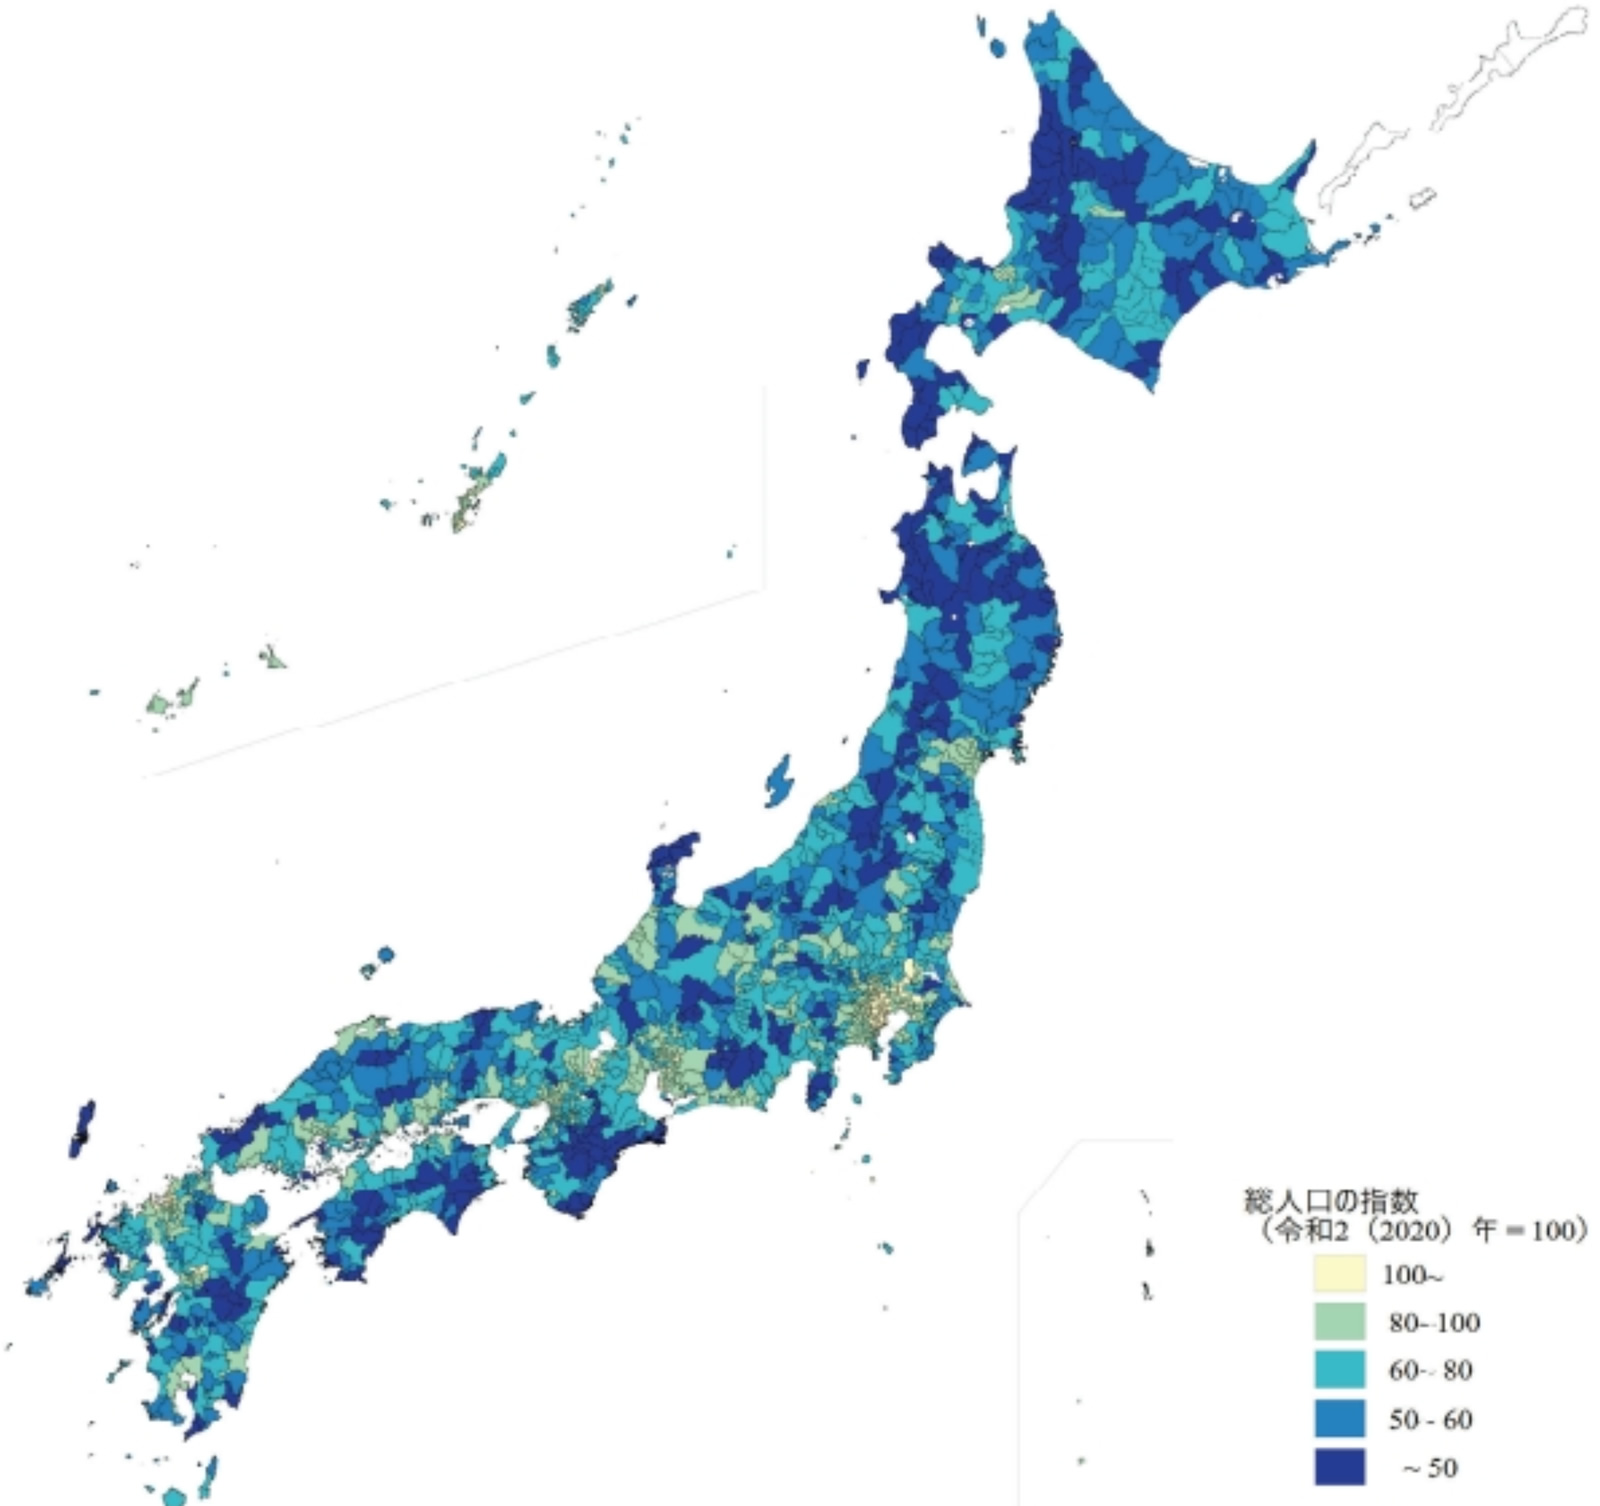
Figure 1. Index of total population in 2050 (with 2020 as 100)
In addition, world population trends are available on the website of the United Nations, Department of Economic and Social Affairs Population Division.
World Population Prospects 2022: https://population.un.org/wpp/
We will introduce them together in this column.
**********
Press Release (Japanese version only) from National Institute of Population and Social Security Research
Approx. 70% of all municipalities have a population of 65 years and older in 2050 that is less than in 2020
Key Points of Estimation Results:
Estimated Future Population by Prefecture:
1. In 11 prefectures, the total population in 2050 compared to 2020 is more than 30% less.
- The total population in 2050 will be lower than in 2020 in all prefectures except Tokyo, and in 11 prefectures such as Akita Prefecture, the total population in 2050 will be more than 30% lower than in 2020. (p.8)
- Although the rate of decline in total population has eased in the national projection compared to the previous projection, the total population in 2045 will be higher than the previous projection in only 25 prefectures other than those belonging to the Tokyo metropolitan area.
2. In 25 prefectures, the percentage of the population aged 65 and over will exceed 40% by 2050.
- In 2050, 25 prefectures, including Akita Prefecture (49.9%), will have more than 40% of their population aged 65 or older, while Tokyo will have the lowest percentage (29.6%). (p.12)
- In Tokyo, Aichi, and Okinawa prefectures, the population aged 65 and over will continue to increase until 2050, while in non-metropolitan areas and other regions, it will begin to decline, and in 26 prefectures the population aged 65 and over in 2050 will be lower than in 2020. (p.11)
Estimated future population by municipality:
1. Approx. 20% of the municipalities will have a total population in 2050 that is less than half of the population in 2020.
- The number of municipalities whose total population in 2050 will decrease from 2020 is 1,651 (95.5% of the total of 1,728 municipalities, counting government-designated cities as one city), of which 605 (35.0%) will decrease by 0 to 30%, 705 (40.8%) by 30 to 50%, and 341 (19.7%) by 50% or more (19.7%). (p.36-37)
2. In 2050, more than 30% of municipalities will have more than half of their total population aged 65 or older, while about 70% of municipalities will have fewer people aged 65 or older in 2050 than in 2020.
- The number of municipalities where the percentage of the population aged 65 and over will increase is 1,696 (98.1% of the total municipalities), and the number of municipalities with more than 50% of the total population will increase from 59 (3.4%) in 2020 to 557 (32.2%) in 2050. (p.45)
- The year with the largest population aged 65 and over is before 2025 in 1,071 municipalities (62.0%), and in 1,182 municipalities (68.4%), the population aged 65 and over in 2050 will be lower than in 2020. (p.39-40)
3. The population of 0-14 year olds in 2050 will be lower than in 2020 in 99% of municipalities.
- The number of municipalities where the percentage of the population aged 0-14 will decline in 2050 compared to 2020 is 1,659 (96.0%), accounting for the majority (p.44), but there are some municipalities, mainly in depopulated areas, where the percentage will increase due to the rapid decline in the elderly population.
- The number of municipalities that will have fewer 0-14 years old in 2050 than in 2020 will reach 1,711 (99.0% of the total). (p.38)
**********
Table 1. Total Population by Prefecture:
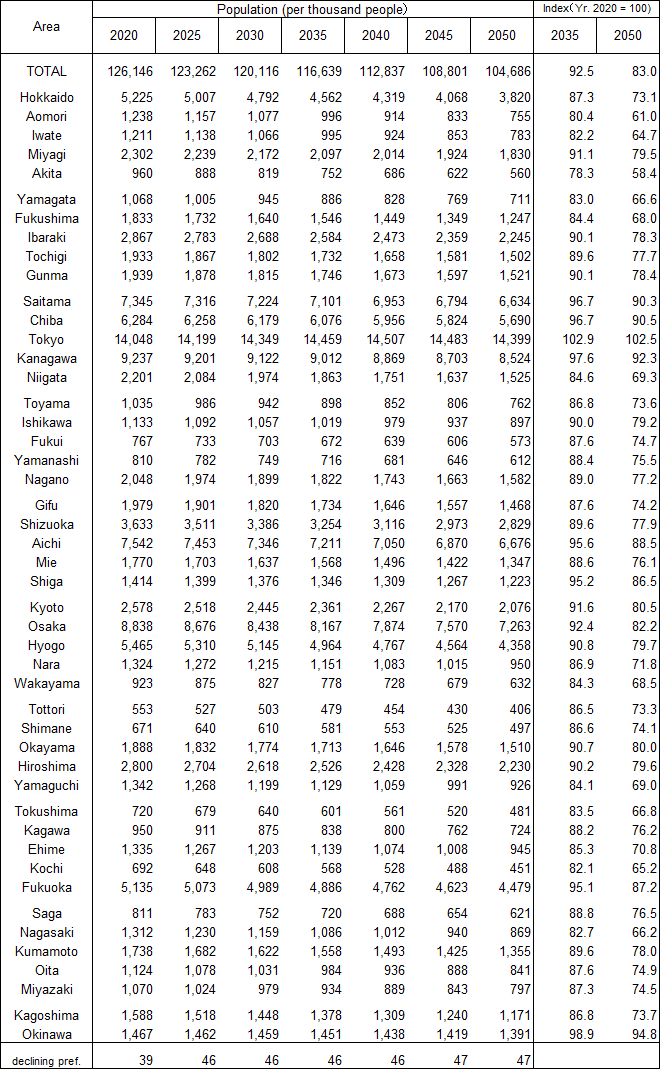
Note 1) The index is the value of the total population when the total population in 2020 is set at 100.
Note 2) Decling prefectures refers to the number of prefectures with a decrease in total population from five years ago.
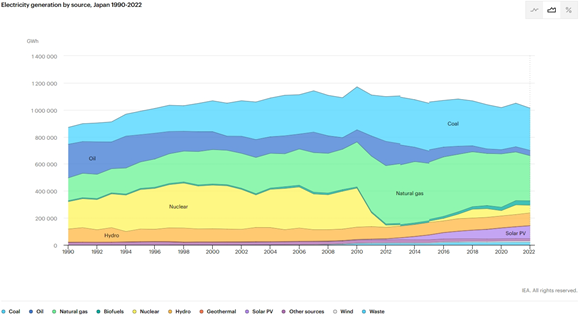
The amount of electricity generated in Japan peaked in 2010 (1,170,872 GWh) and has been on a gradual downward trend, reaching 1,012,890 million GWh in 2022 (13.5% less than in 2010).
Graph 1. Power Generation in Japan (1990-2022):
Graph 2. Population trend in Japan over the same period (1990-2021):
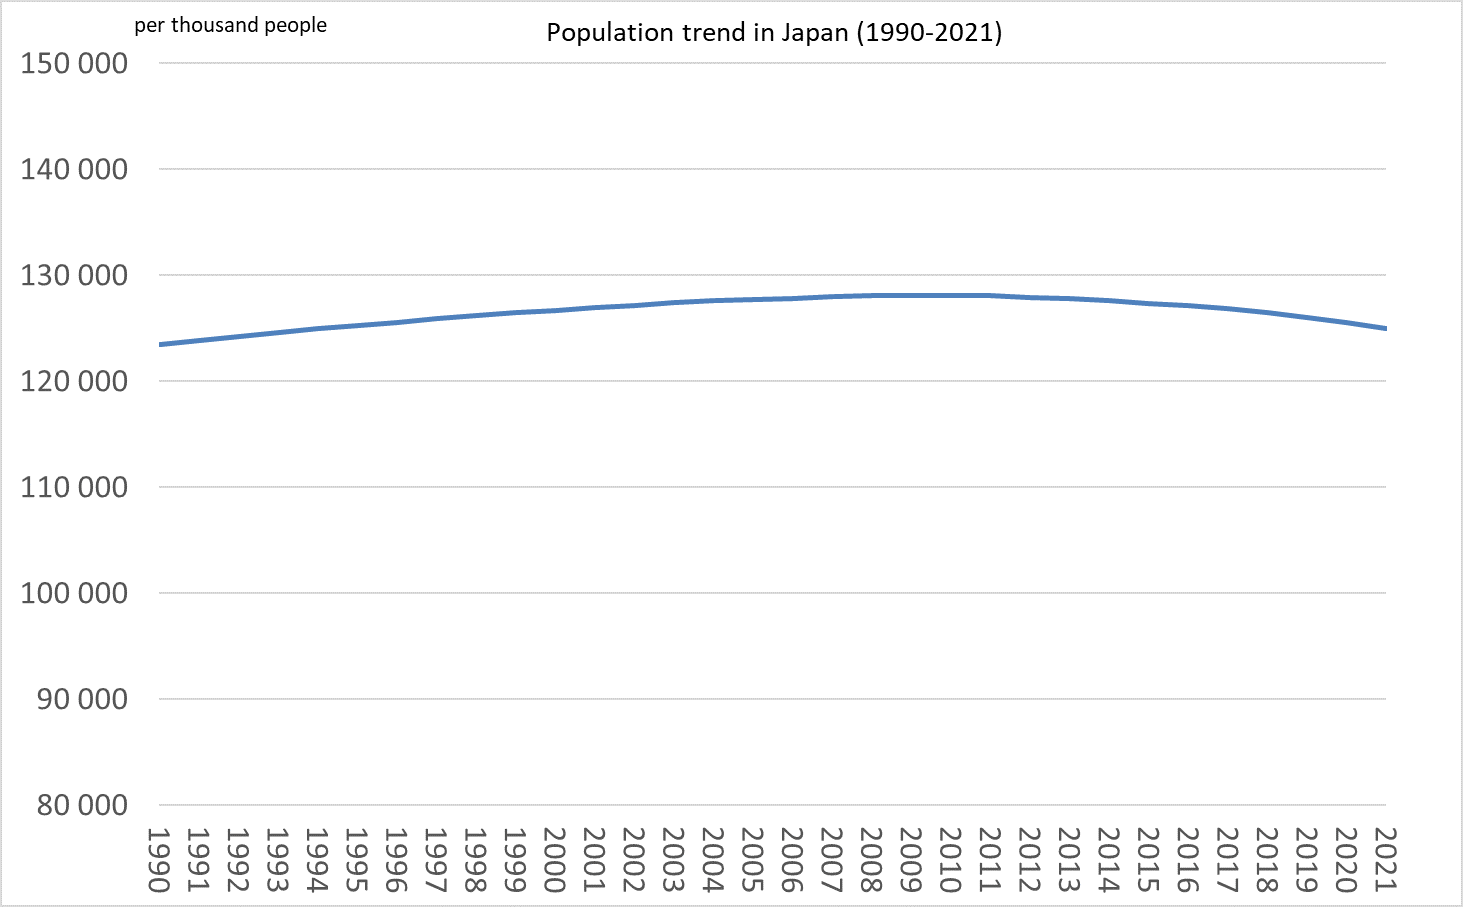
From 1990 to 2010, while Japan’s population remained almost flat, the rate of increase in electricity generation was higher, due to changes in domestic industry, lifestyle economic conditions, and other factors. Since 2010, both population and power generation have been on a gradual downward trend, but the decline in power generation has tended to be slightly larger. The population of Japan in 2022 is about 124 million (In 2010, 128 million, down about 4%).
The amount of electricity generated is converted in terms of Japan’s population,
2010: approx. 9.14 MWh/person
2022: approx. 8.15 MWh/person
This is an 11% decrease compared to 2010.
Graph 3. World population trend (2022-2050):
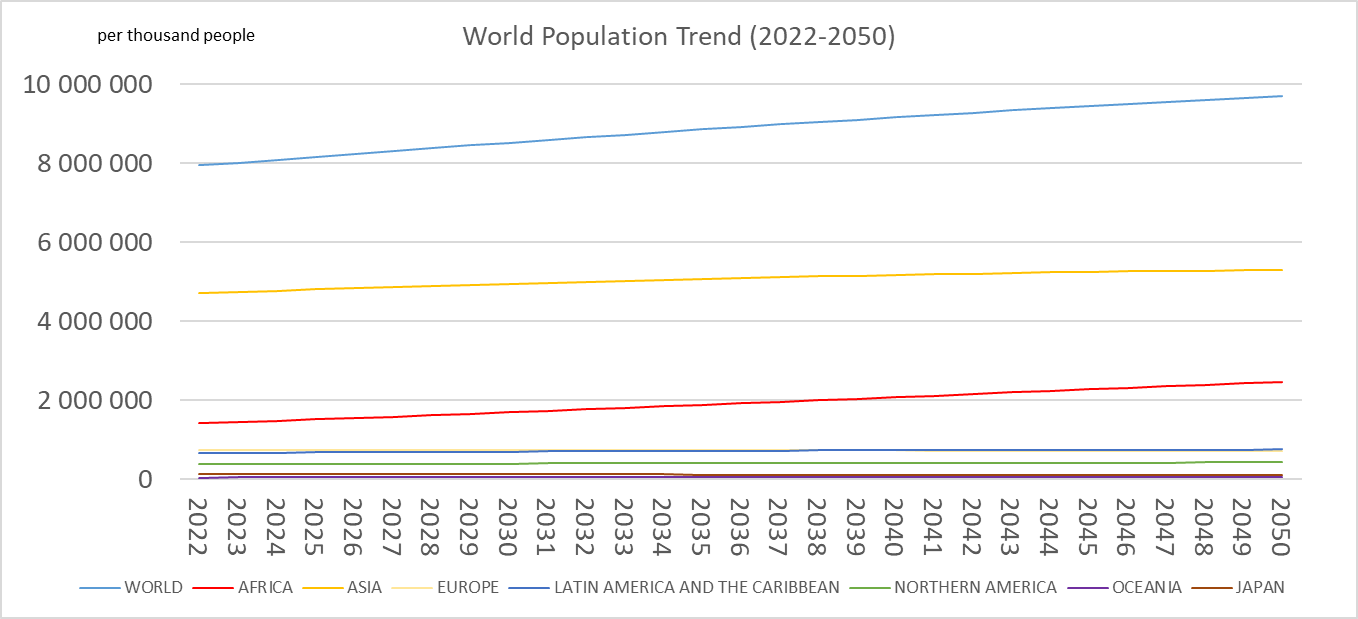
According to the demographic data of the United Nations, the world population is expected to increase by 22% from 7.94 billion in 2022 to 9.7 billion in 2050, while Japan’s population is expected to decrease by 16% from 124 million in 2022 to 104 million in 2050, and the population is expected to depopulate and age.
We intend to contribute to the development and utilization of renewable energy sources such as solar PV in response to future population trends and lifestyle changes.
Source: National Institute of Population and Social Security Research
Source: IEA: International Energy Agency, Data and Statistics
Quotation: United Nation, the Department of Economic and Social Affairs Population Division