PV column
Photovoltaic
2022/08/11
U.S. Solar Photovoltaic System and Energy Storage Cost Benchmarks by National Renewable Energy Laboratory (NREL)
The National Renewable Energy Laboratory (NREL) in the United States published many scientific and technical documents and obtained patents each year. In this column, we would like to share with you the executive summary of the “U.S. Solar PV System and Energy Storage Cost Benchmarking (76 pages),” which was released in November 2021.
Source: U.S. Solar Photovoltaic System and Energy Storage Cost Benchmarks: Q1 2021
(Conversion, Japanese version only)
The USD amounts in the original report are converted to Japanese yen using the average exchange rate of 135.0 yen to the USD in August 2022.
*****
Executive Summary
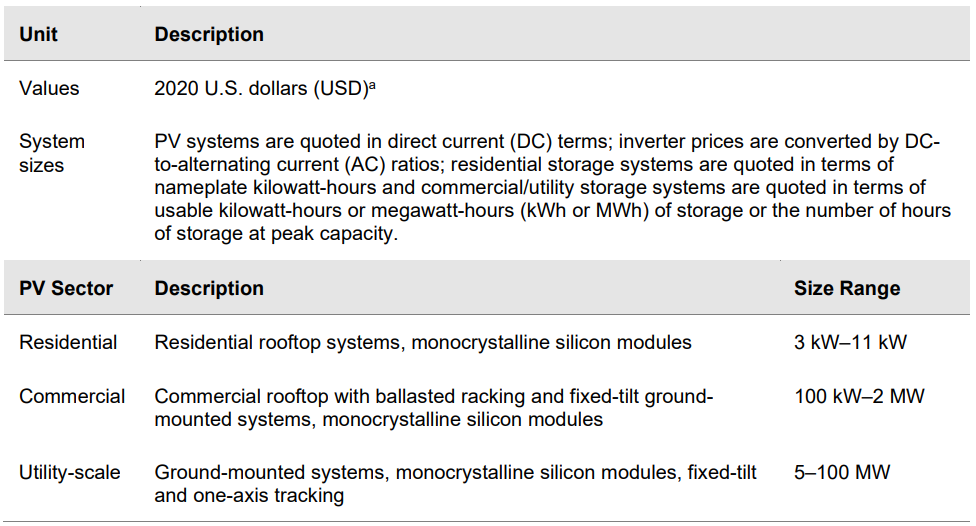
This report benchmarks installed costs for U.S. solar photovoltaic (PV) systems as of the first quarter of 2021 (Q1 2021). We use a bottom-up method, accounting for all system and project development costs incurred during installation to model the costs for residential, commercial, and utility-scale PV systems, with and without energy storage. We attempt to model typical installation techniques and business operations from an installed-cost perspective. Costs are represented from the perspective of the developer/installer; thus, all hardware costs represent the price at which components are purchased by the developer/installer and do not account for preexisting supply agreements or other contracts. Importantly, the benchmarks also represent the sales price paid to the installer. Therefore, they include profit in the cost of the hardware*1; the profit the installer/developer receives is reported as a separate cost category on top of all other costs to approximate the final retail price paid to the installer/developer. Benchmarks also assume a business environment without any impact from the novel coronavirus pandemic. Finally, our benchmarks are national averages calculated using average values across all states. Table ES-1 summarizes the first-order benchmarking assumptions.
Table ES-1. Benchmarking Assumptions
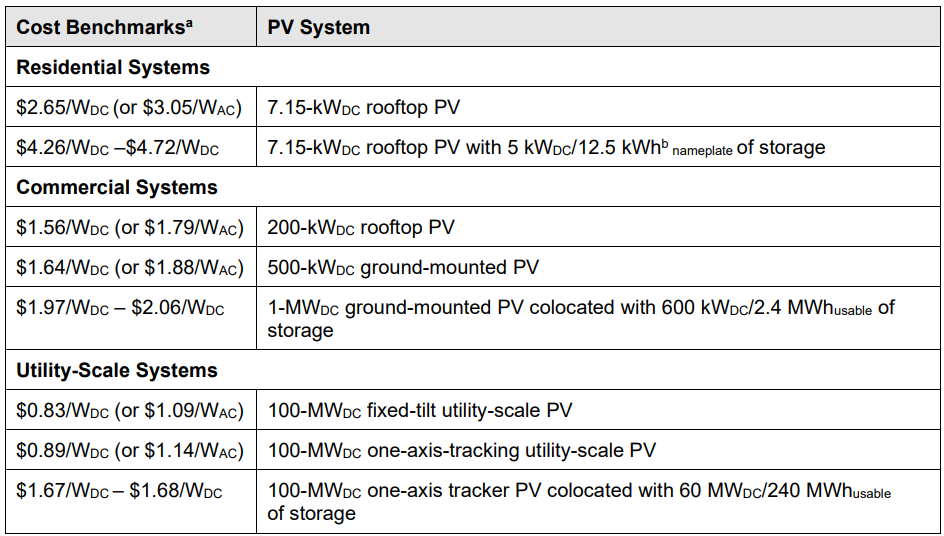
Based on our bottom-up modeling, the Q1 2021 PV and energy storage cost benchmarks are those listed in Table ES-2:
Table ES-2. Q1 2021 PV and Energy Storage Cost Benchmarks
b. All energy storage capacity rating mentioned in this report are in DC.
It should be noted that the interconnection capacity of all these systems is assumed to be equal to the total AC capacity of the system. All data relevant to the reported results in this report can be found in the NREL Data Catalog.*2 Figure ES-1 (page vi) compares our Q1 2021 PV-only benchmarking results to the Q1 2020 National Renewable Energy Laboratory benchmarking analyses.*3
Figure ES-1. Comparison of Q1 2020 and Q1 2021 PV cost benchmarks
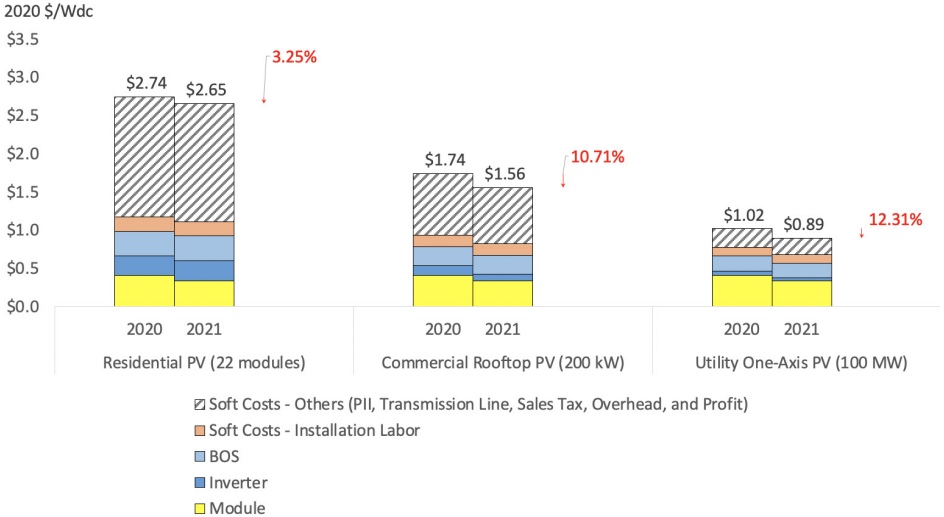
Between 2020 and 2021, there were 3.3% ($0.09/W), 10.7% ($0.19/W), and 12.3% ($0.13/W) reductions (in 2020 USD) in the residential, commercial rooftop, and utility-scale (one-axis) PV system cost benchmarks respectively. Balance of system (BOS) costs have either increased or remained flat across sectors, year-on-year, unlike in previous benchmarking reports, which generally have reported declining BOS costs. The increase in BOS cost has been offset by a 19% reduction (in 2020 USD) in module cost. Overall, modeled PV installed costs across the three sectors have declined compared to our Q1 2020 system costs. Table ES-3 shows the benchmarked values for all three sectors and the drivers of cost decreases and increases.
Table ES-3. Comparison of Q1 2020 and Q1 2021 PV System Cost Benchmarks
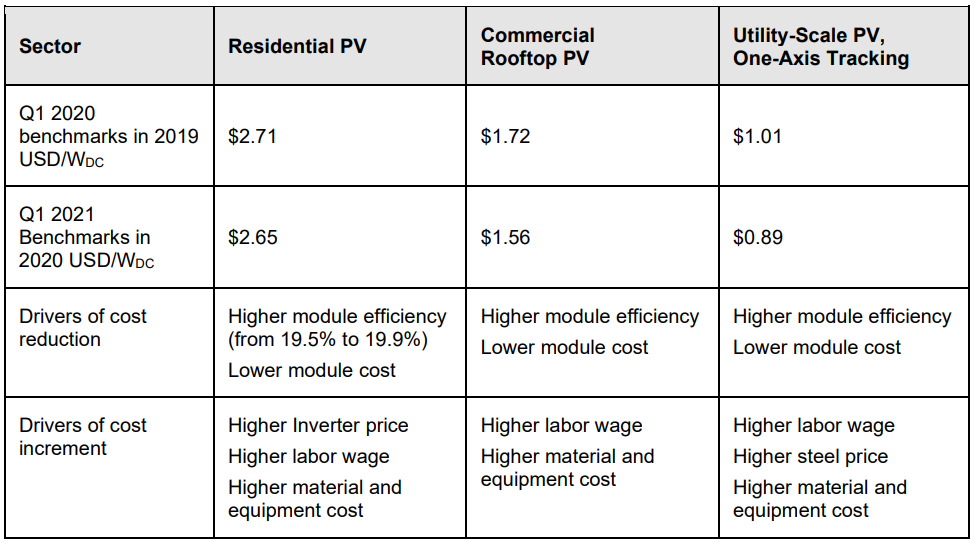
Figure ES-2 shows the difference between Q1 2021 and Q1 2020 benchmark values adjusted for comparison. In addition to changing the dollar year from 2019 to 2020, we adjusted Q1 2020 values to have the same size storage capacity as the current Q1 2021 sizes to better demonstrate cost changes between years.
Figure ES-2. Comparison of Q1 2020 and Q1 2021 stand-alone BESS cost benchmarks
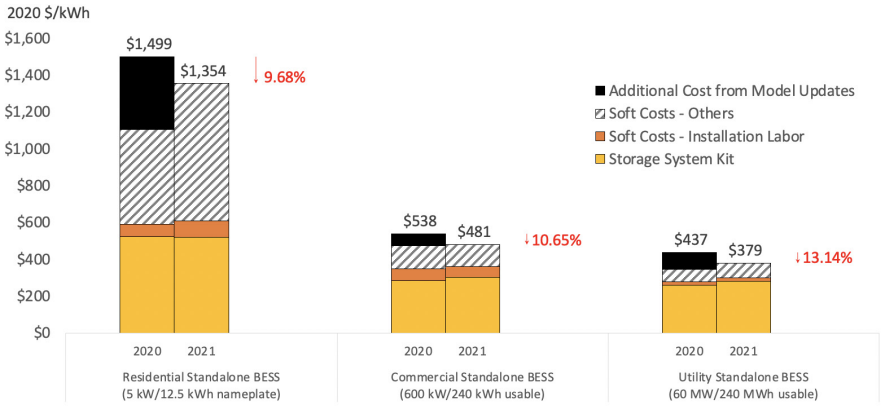
Figure ES-3 shows approximately 6% and 3% reductions in residential PV-plus-storage benchmark between 2020 and 2021 for DC-coupled and AC-coupled cases respectively.
Figure. Example of DC and AC coupling configurations
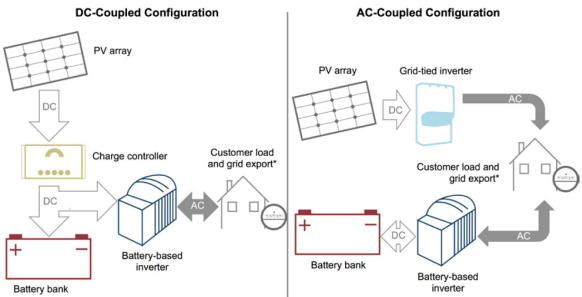
Most of these reductions can be attributed to reductions in the cost of PV modules and battery packs. The cost reductions occurred despite the rated capacity of the 22-module system increasing from 7.0 kW to 7.15 kW between 2020 and 2021.
Figure ES-3. Comparison of Q1 2020 and Q1 2021 residential PV-plus-storage System Cost Benchmarks
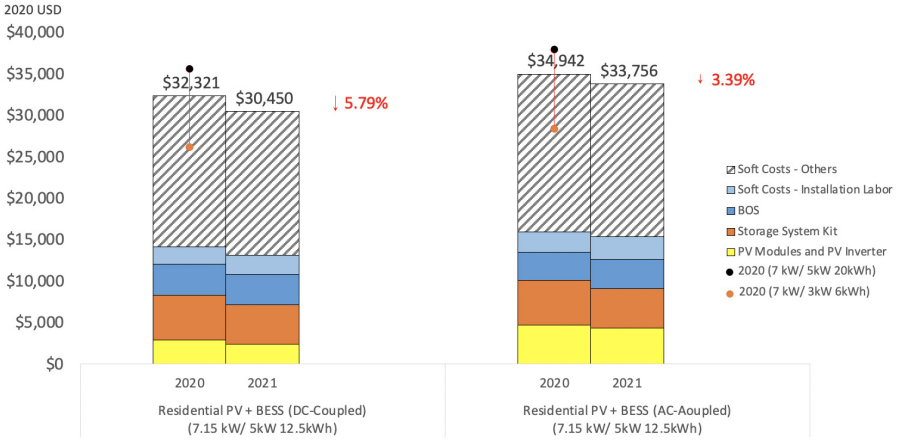
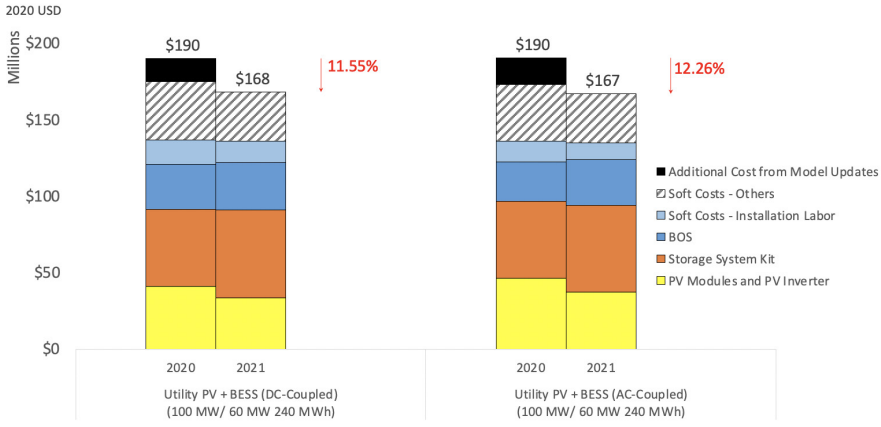
Figure ES-4 shows the 9.3% and 9.5% reductions in commercial PV-plus-storage benchmark between 2020 and 2021 for DC-coupled and AC-coupled cases respectively. Figure ES-5 shows the 11.6% and 12.3% reductions in utility-scale PV-plus-storage benchmark between 2020 and 2021 for DC-coupled and AC-coupled cases respectively. Increased DC-DC converter cost in 2021 makes DC-coupled systems cost higher than AC-coupled systems.
Figure ES-4. Comparison of Q1 2020 and Q1 2021 commercial PV plus-storage system cost benchmarks
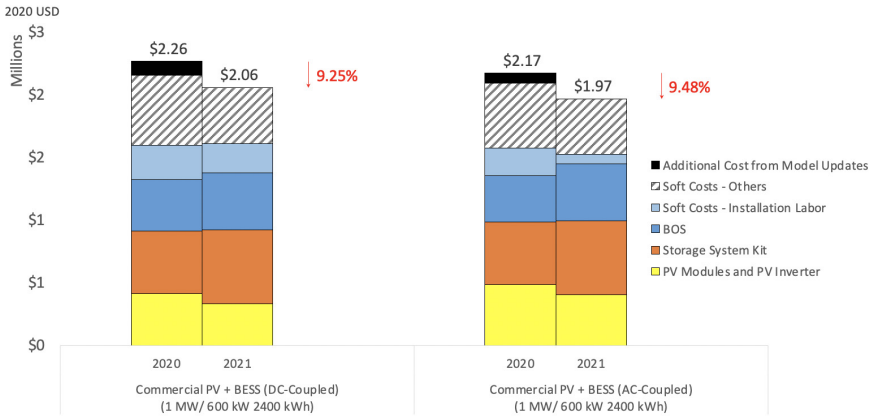
Figure ES-5. Comparison of Q1 2020 and Q1 2021 utility-scale PV-plus-storage system cost benchmarks
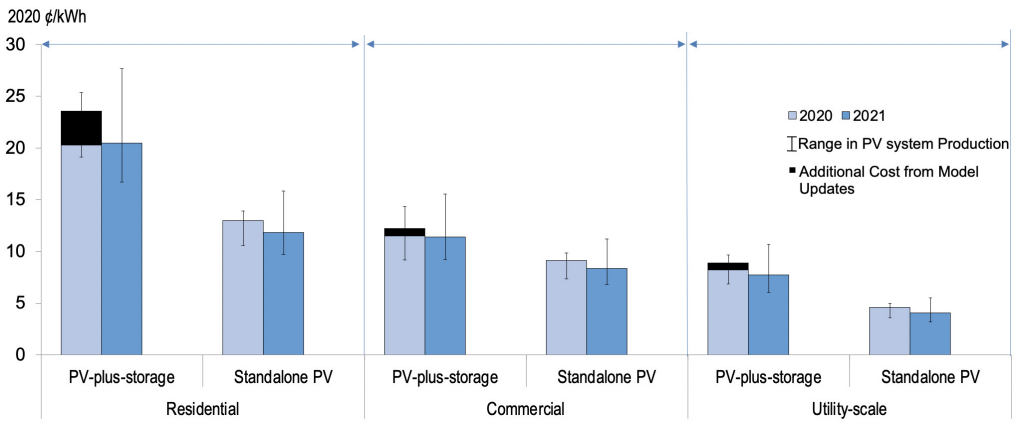
The changes in installed cost—along with changes in operation, system design, and technology—have resulted in changes in the levelized cost of energy (LCOE) (Figure ES-6). From 2020 to 2021, residential PV-plus-storage LCOE fell 13%*4, and residential stand-alone-PV LCOE fell 9%; there were 7% and 13% reductions in levelized electricity costs for commercial and utility-scale PV-plus-storage systems respectively. At the same time, LCOE of commercial and utility scale PV systems fell by 9% and 12% respectively.
Figure ES-6. LCOE, 2020–2021
- Profit is one of the differentiators of “cost” (aggregated expenses incurred by a developer or installer to build a system) and “price” (what an end user pays for a system).
- “Data File (U.S. Solar Photovoltaic BESS System Cost Benchmark Q1 2020 Report)” NREL, https://data.nrel.gov/submissions/158.
- Appendix B summarizes benchmark results for all previous NREL benchmark analyses (2010–2021).
- Reported 2021 residential LCOE of PV plus storage system (LCOSS) values are 17% higher than 2020 values because the 2021 report models a larger battery system (5 kW; 12.5 kWh) than the 2020 benchmark report (3 kW/ 12.5 kWh). When using 2020 LCOE of PV plus storage system model assumptions, the 2020 value rises from 20.1¢/kWh to 21.5¢/kWh.
*****
Please refer to the full report here (76 pages in total) for detailed data and analysis reports on each model.
Source: NREL https://www.nrel.gov/docs/fy22osti/80694.pdf