PV column
energy
2022/07/21
The Environmental and Public Health Benefits of Penetration of Solar Energy
In Japan, people tend to talk about photovoltaic power generation in terms of easy-to-understand indicators such as CO2 reduction and return on investment, or in terms of their own personal image of photovoltaic power generation. It is difficult to see information and analysis of the expected effects of developing as an infrastructure.
In this column, we will discuss the expected benefits of the three major potential environmental and health benefits identified by the U.S. Department of Energy’s May 2016 SunShot Initiative through its analysis of the three major potential benefits: reduced greenhouse gas emissions, health and environmental impacts of air pollution, and reduced water consumption.
(Conversion, Japanese version only)
The U.S. dollar amounts in the original report are converted to Japanese yen using the average exchange rate of 137.0 yen to the U.S. dollar in July 2022.
The conversion is also shown in 1 US gallon = 3.785 liters.
Source: U.S. Department of Energy, Solar Energy Technologies Office
*****
Executive Summary
The U.S. Department of Energy’s SunShot Initiative (SunShot) seeks to motivate swift reductions in the cost of solar energy in order to strengthen the role of solar as a low-cost energy source. The SunShot Vision Study (DOE 2012) evaluated the profound implications of such cost reductions for the solar industry, the electricity sector as a whole, and end-use electricity consumers, finding that achieving the SunShot cost targets could result in overall solar electricity penetrations of 14% of annual U.S. electricity demand by 2030 and 27% by 2050. Analyzed solar technologies included photovoltaics (PV) and concentrating solar power (CSP). That study, however, did not comprehensively quantify and value the potential environmental and health benefits associated with achieving these levels of solar penetration.
Our analysis fills that gap by thoroughly assessing three key potential environmental and health benefits of achieving the solar penetrations envisioned in the SunShot Vision Study: greenhouse-gas (GHG) emissions reductions, air-pollution health and environmental impacts, and water-use reductions. Specifically, we use a scenario-analysis approach in which the 14%-by-2030 and 27%-by-2050 “SunShot Vision” scenario is compared with a ”No New Solar (NNS) baseline” scenario in which no new solar is deployed after 2014. This framework allows us to assess the potential benefits of all incremental solar deployment. We employ the National Renewable Energy Laboratory’s Regional Energy Deployment System (ReEDS) electric sector capacity-expansion model to conduct our analysis, updating the analysis conducted in the SunShot Vision Study. For each of the three benefit categories, we take the modeled output from ReEDS and then apply additional tools—as necessary—to assess potential benefits in physical and, where feasible, monetary terms. We qualify the study results where appropriate, and highlight areas of uncertainty not otherwise explicitly addressed in our analysis.
The United States is already benefiting from an existing fleet of solar power projects. Evaluating the potential environmental and health benefits of that existing solar generation helps provide context for the future scenario analysis. To this end, we briefly assess the recent benefits of the 2014 U.S. solar fleet. In this case, we use the Environmental Protection Agency (EPA)’s Avoided Emissions and geneRation Tool (AVERT) to estimate the characteristics and location of fossil generation sources displaced by the 20 gigawatts (GW) of year-end 2014 solar capacity. As with the forward-looking analysis of the SunShot Vision scenario, we assess the potential benefits in physical and monetary terms using appropriate additional tools.
As summarized below and in Figures ES-1 (SunShot Vision), ES-2 (solar fleet at end of 2014), and ES-3 (regional results associated with solar fleet at end of 2014), our analysis finds that a future U.S. electricity system in which solar plays a major role would result in enduring environmental and health benefits; that the existing fleet of solar power plants is already offering a down-payment towards those benefits; and that there are sizable regional differences in the magnitude of the benefits.
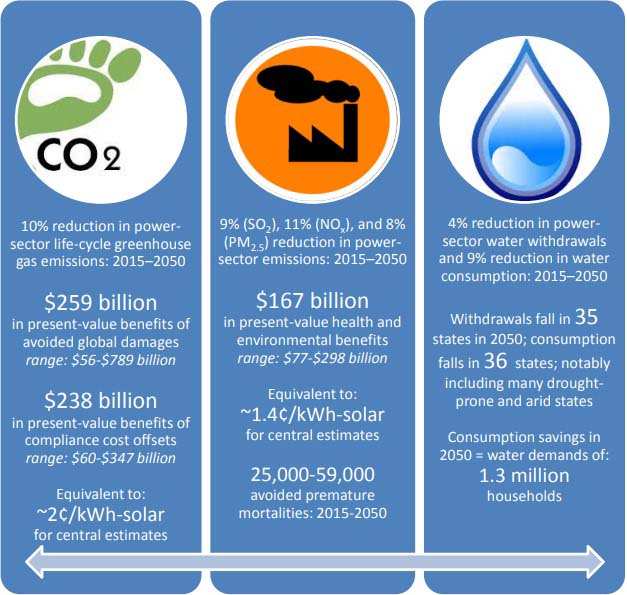
Greenhouse Gas Emissions
• SunShot Vision: Achieving the SunShot Vision scenario reduces life-cycle GHG emissions from the power sector by 13% in 2030 and 18% in 2050, relative to the NNS baseline scenario. Cumulative GHG savings from 2015 to 2050 equal 10% of life-cycle emissions from the power sector.i These reductions produce global benefits of $259 billion in the form of lower future climate change damages when applying a central value for the social cost of carbon (SCC), which is equivalent to a levelized benefit of solar of 2.2¢/kWh-solar. If, instead, solar is viewed as a way to meet future legal requirements to reduce carbon emissions—and therefore offsets the cost of complying with those regulations—then, under a medium trajectory for the cost of those future regulations, the SunShot Vision scenario yields $238 billion in savings, which is equivalent to a levelized benefit of 2.0¢/kWh-solar.
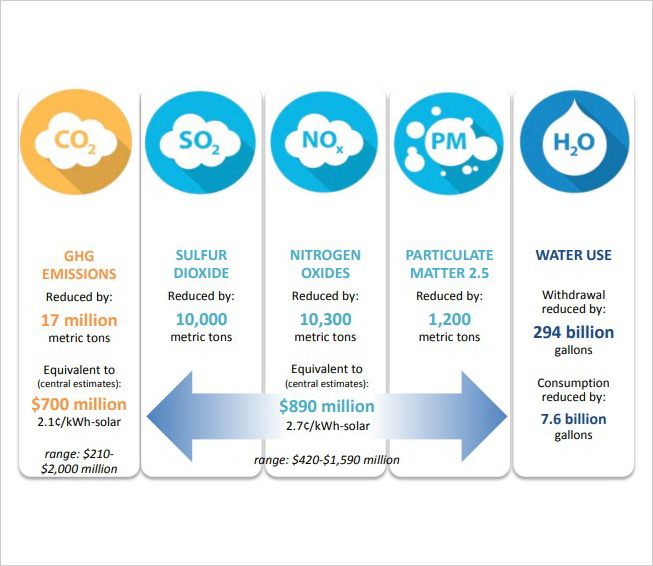
• Solar Fleet at End of 2014: These potential future benefits build on the 17 million metric tons of CO2 savings realized annually from the 2014 solar fleet, which is equivalent to an annual global benefit of $700 million (2.1¢/kWh-solar) when applying a central value for the social cost of carbon.
Air-Pollution Emissions
• SunShot Vision: Achieving the SunShot Vision scenario reduces emissions of sulfur dioxide (SO2), nitrogen oxides (NOx), and fine particulate matter (PM2.5) in the power sector by 14%, 14%, and 13% in 2030 and 15%, 18%, and 13% in 2050, relative to the NNS baseline scenario. Cumulative emissions savings from 2015 to 2050 equal 9%, 11%, and 8% of power-sector SO2, NOx, and PM2.5 emissions, respectively. These reductions produce benefits of $167 billion in the form of lower future health and environmental damages based on central estimates which is equivalent to a levelized benefit of 1.4¢/kWh-solar. The benefits derive, in large measure, from a reduction in premature mortality from sulfate particles from SO2 emissions—achieving the SunShot Vision scenario reduces premature mortalities by 25,000–59,000 based on methods developed by the U.S. Environmental Protection Agency.
• Solar Fleet at End of 2014: These potential future benefits build on annual reductions of 10,000, 10,300, and 1,200 metric tons of SO2, NOx, and PM2.5, respectively, from the 2014 solar fleet, which provide annual domestic air quality benefits of $890 million (2.7¢/kWh-solar) based on central estimates
Water-Use Reductions
• SunShot Vision: Achieving the SunShot Vision scenario reduces power-sector water withdrawals by 8% in 2030 and 5% in 2050, relative to the NNS baseline scenario, while power-sector water consumption is reduced by 10% in 2030 and 16% in 2050. Cumulative water impacts from 2015 to 2050 equal 46 trillion gallons of avoided withdrawal (4% of total power-sector withdrawals) and 5 trillion gallons of avoided water consumption (9% of total power-sector consumption). By 2050, water withdrawals in the continental United States are lower than the NNS baseline scenario in 35 of 48 states, and water consumption is lower in 36 of 48 states. Importantly, drought-prone and arid states are among those with the largest reductions in water use. These results assume dry cooling for CSP plants; greater use of wet or hybrid cooling reduces modestly the national water savings (e.g., water consumption savings drop from 16% in 2050 to 12% in 2050).
• Solar Fleet at End of 2014: These potential future savings build on the water-use reductions from the 2014 solar fleet, including annual withdrawal and consumption savings of 294 billion gallons (0.8% of power sector total) and 7.6 billion gallons (0.5% or power sector total), respectively, with much of those savings located in drought-impacted California.
The total monetary value of the GHG and criteria air pollution benefits of the SunShot Vision scenario exceed $400 billion in present-value terms under our central estimates, which is equivalent to roughly 3.5¢/kWh-solar. Focusing on the existing end-of-2014 fleet of solar power projects, recent annual benefits equal more than $1.5 billion under our central estimates, which is equivalent to 4.8¢/kWh-solar. These are central estimates, with a sizable range of uncertainty. The figures exclude the value of reduced water use—for which monetary quantification was not feasible—as well as other non-quantified environmental considerations.
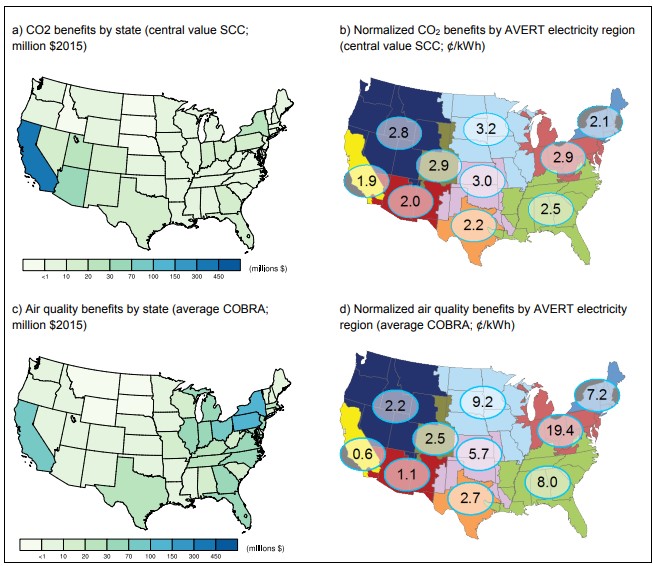
It is important to recognize that the environmental and health benefits of solar are strongly dependent on not only the amount of solar deployment but also the location of that deployment—solar that displaces higher-emitting coal generation has substantially larger benefits than solar that displaces lower-emitting gas-fired (or even wind) generation. Focusing on recent benefits from the end-of-2014 solar power fleet, Figure ES-3 illustrates the sizable regional variations in both the absolute magnitude of the GHG and air quality benefits and how those benefits translate on a normalized ¢/kWh-solar basis. About two-thirds of total end-of-2014 solar generation is delivered to California, and California accounts for roughly half of the recent total global GHG benefits. On a normalized ¢/kWh-solar basis, recent GHG-reduction benefits range from 1.9 to 3.2¢/kWh-solar depending on the region, when a central value for the social cost of carbon is applied. Normalized health-related air quality benefits are especially sensitive to regional attributes, with recent benefits ranging from 0.6 to 19¢/kWh-solar, driven in significant measure by the degree to which higher-emitting coal-fired generation is displaced by solar.
Decision makers will naturally wish to compare these potential environmental and health benefits with, among other things, the potential costs and risks introduced by adding solar to the electric system as well as the potential impacts of solar on local ecosystems and communities. Although not addressed in this report, the SunShot Vision Study (DOE 2012) provides a thorough initial assessment of electric-system costs and impacts, while other papers in the On the Path to SunShot Study series help inform such comparisons.
Finally, although the present work might inform policy decisions, it does not intend to suggest any specific type of policy. The costs and benefits of increased solar deployment will be impacted by the policy and market mechanisms used to effect that development; therefore, this analysis quantifies the general magnitude of environmental and health benefits only. Moreover, while the analysis presented in this report suggests a significant possible role for solar energy in delivering environmental and health benefits, previous research shows that achieving those benefits in the most cost-effective way might be best supported by a policy framework that directly addresses key market failures and unpriced externalities rather than solely using technology- or sector-specific incentives.
Source: The National Renewable Energy Laboratory (NREL) at
https://www.nrel.gov/research/publications.html
*****
Acknowledgements:
We would like to thank the U.S. Department of Energy for providing us with a very informative report on solar energy.