PV column
Solar modules
2022/07/01
Solar Module Quality Assessment Reports
In the past, the quality of photovoltaic modules, the face and symbol of photovoltaic power plants, has been subject to image-based rumors, overblown reports of specific problems, and overestimation of the quality of certain materials, components, and production facilities. Currently, through various third-party evaluation reports, we have established an evaluation system that is not influenced by rumors.
In this column, we would like to provide an overview of the most well-known module evaluation report, the “2022 PV MODULE RELIABILITY SCORECARD” published by PV Evolution Labs (PVEL) of the United States.
Source: https://modulescorecard.pvel.com/
*****
Top Performers
Every year, our Scorecard recognizes manufacturers that produce PV modules with excellent results in PVEL’s independent testing.
122 model types from 25 manufacturers are named as 2022 Top Performers for their superior results in PVEL’s Product Qualification Program.
Go to Top Performers Page: https://modulescorecard.pvel.com/top-performers/
Resilience of Manufacturers
Manufacturers overcame significant challenges last year, from instability in the raw material supply chain to logistics bottlenecks. Explore examples of resilience from Alex Barrows, Head of PV at Exawatt.
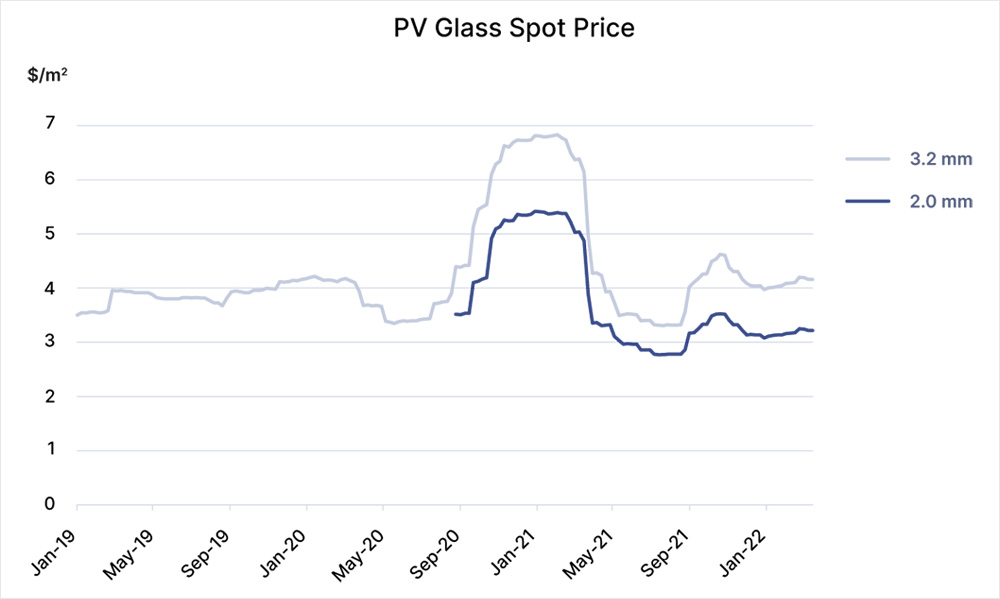
Raw Material Challenges: PV Glass
In late 2020 PV glass prices spiked, with spot prices nearly doubling between July 2020 and December 2020 for many reasons including:
Increased demand for glass/glass modules.
- Temporary production declines as manufacturers shifted to thinner glass.
- However, glass manufacturers rapidly resolved manufacturing issues and ramped up new capacity. Prices dropped in early 2021 and have since remained relatively stable, despite continued production challenges.
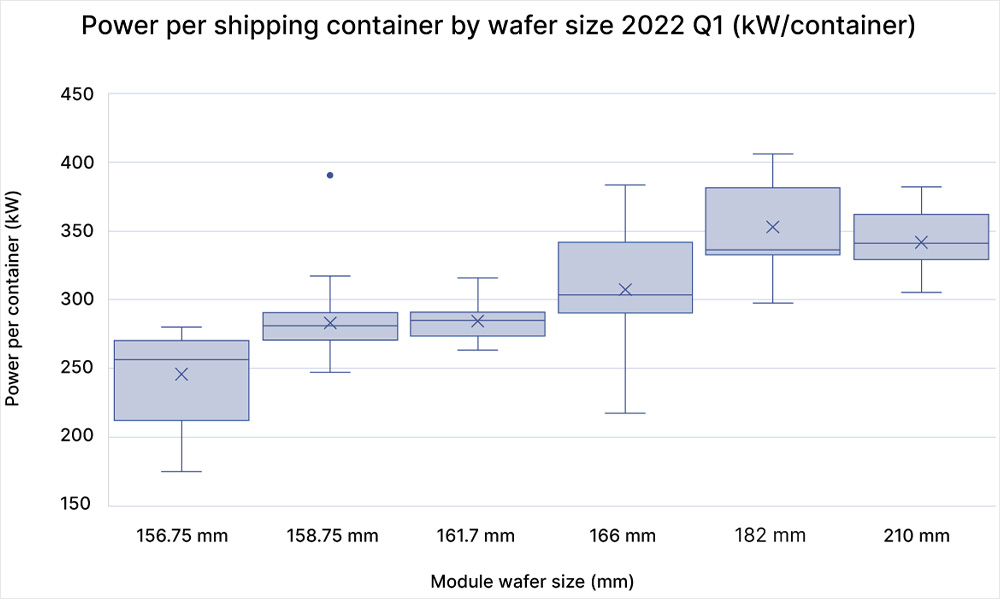
Shipping Challenges: More Power per Container
Since early 2020, average global ocean shipping costs have increased by around 600%. Shipping costs from China and Southeast Asia to the West Coast of the U.S. spiked by >10x.
But the trend toward larger PV wafers can partially offset higher costs. Modules based on 182 mm and 210 mm wafers have average packing densities around 40% higher than those based on 156.75 mm wafers.
Manufacturers of 210 mm-based modules significantly improved packing density during the past year, with the average power per 40’ (12m) high cube container jumping to >340 kW in Q1 2022, an increase of almost 20% from 12 months earlier.
The data above is based on 40’ (12m) high cube containers. Each series represents the range of power per container for a single module series based on its average module power.
Methodology
We use a consistent methodology for testing and ranking PV modules: the Product Qualification Program. Our process helps buyers compare products consistently from year to year and Scorecard to Scorecard.
Our testing goes beyond the model types of PV modules to assess bills of materials. This approach ensures buyers can procure the specific products that we have validated in testing.
Contents of Methodology (https://modulescorecard.pvel.com/methodology/):
PVEL’s consistent approach to testing and benchmarking PV module reliability drives data-driven solar procurement and investments for developers, financiers, and asset owners.
Testing Unique Bills of Materials:
Although Top Performers are listed by model type, they represent unique bills of materials (BOMs) that PVEL has tested in our Product Qualification Program (PQP).
Go Inside a PV Module:
Scroll to explore the materials inside a PV module. Click on labels to see how many types of each component were used in the BOMs tested for the 2022 Scorecard.
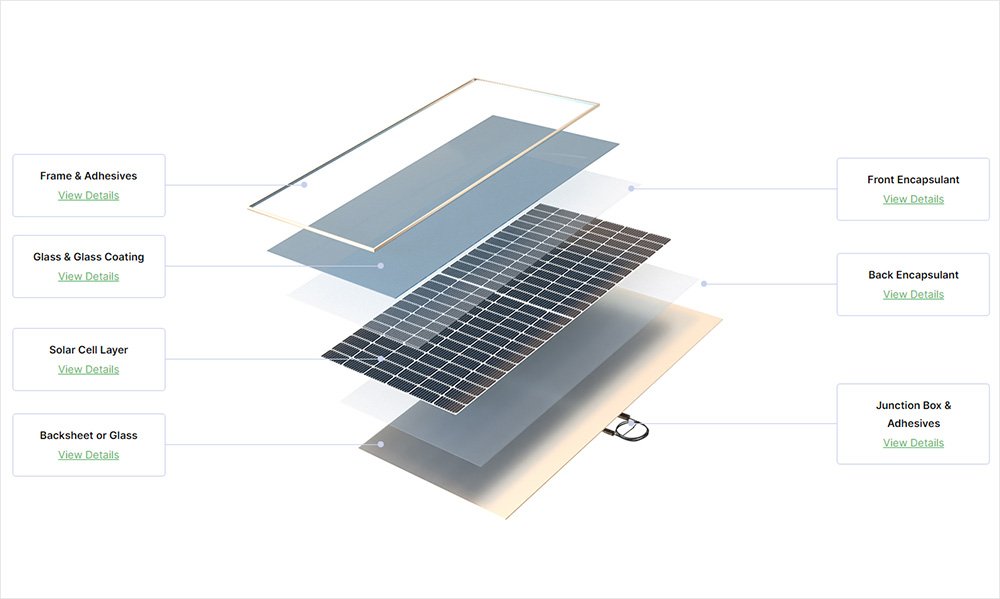
Frame & Adhesive:
Frame
Provides mechanical reinforcement and allows the module to be mounted to racking. Improper frame design can lead to mechanical failure and/or cell damage, decreases power output.
Frame heights tested for this Scorecard: 6
Frame Adhesive
Adheres the frame to the module. Improper frame attachment can increase the likelihood of module damage and/or cell cracks.
Frame adhesive types tested for this Scorecard: 15
Glass & Glass Coating
Front Glass:
Allows light to reach the cell while protecting the module from moisture and impacts. Glass cracks can lead to corrosion and safety issues.
Suppliers tested for this Scorecard: 12
Glass Coating:
A material on the glass surface that increases module efficiency by reducing light reflections. Energy yield decreases when coating deteriorates.
Models tested for this Scorecard: 24
Front Encapsulant
Bonds solar cells to the front surface of the module. Degradation can result in discoloration, delamination and/or corrosion.
Models tested for this Scorecard: 27
Solar Cell Layer
Cells
The cells capture sunlight and convert it to electricity. Failure significantly reduces output power of the module.
Manufacturers tested for this Scorecard: 23
Interconnects
Cell interconnects provide contact between the cells and module conductors. Damage can cause a short circuit and loss of electrical current flow.
Types tested for this Scorecard: >15
Flux
Cleans cell interconnect and the cell surface, allowing proper soldering to occur. Chemical reactions between the flux and other module chemistries can cause solder bond corrosion, leading to power loss and/or hot spots.
BOM data: 14 different flux models were tested for this Scorecard.
Back Encapsulant
Bonds solar cells to the rear surface of the module. Degradation can result in discoloration, delamination and/or corrosion.
Models tested for this Scorecard: 33
Backsheet or Glass
Covers and protects the back of modules. In bifacial modules, a transparent rear surface allows reflected light into the module. Cracked backsheet or rear-side glass can lead to delamination, corrosion, and/or safety concerns.
Types tested for this Scorecard: 34
71% of BOMs used a backsheet; 29% used rear glass
Junction Box & Adhesives
Junction Box
The junction box houses and protects the bypass diodes and electrical terminations between the inner module circuit and external cables. Improper sealing allows moisture and/or debris inside the junction box, which can lead to corrosion and/or electrical failure and fire.
Suppliers tested for this Scorecard: 18
Junction Box Pottant
A gel that seals and protects the inner junction box components.
Poor quality pottant or curing lets moisture into the junction box, which can cause corrosion of the interconnects and junction box failures.
Pottant types tested for this Scorecard: 14
Diodes
Conducts current during module shading to prevent hot spot damage. Failed diodes short circuit 1/3 of the module output or allow hot spots that can create cell cracks and melt module materials.
Suppliers tested for this Scorecard: 23
Junction Box Adhesive
Adheres the junction box to the module. Improper junction box adhesive can allow moisture ingress and safety issues.
Adhesive types tested for this Scorecard: 15
Connectors
The electrical connection point between modules. Connector mismatch or improper installation can cause arcing and fires.
Suppliers tested for this Scorecard: 17
Why BOM-Level Testing is Important
PVEL’s test results from the lab and field demonstrate that individual PV module components can dramatically affect product quality. PV modules with the exact same model type can be manufactured from completely different BOMs. Suppliers are free to mix-and-match integral materials – even cells – as long as all the components are listed in the model’s IEC certification report.
PVEL’s testing generates vital procurement intelligence.
While individual BOMs are not marketed to buyers, PQP reports clearly document the BOMs of each model that performed well in testing. PVEL’s downstream partners can leverage PQP reports to specify BOMs in supply agreements.
Who Qualifies for the Scorecard
To be eligible for the Scorecard, manufacturers must have:
- Completed the factory witness within 18 months of 2022.
- Submitted all modules to all reliability tests.
- Submitted at least two factory-witnessed PV module samples per test sequence.
How BOMs are Scored
The 2022 PV Module Reliability Scorecard shows Top Performers for six PQP test categories.
Top Performers are determined by averaging the results of every BOM tested by PVEL that is sold under the same model type. Top Performers in each of the reliability tests appearing in the Scorecard must have < 2% power degradation following the particular test. PAN Performance Top Performers must place in the top quartile for energy yield in PVEL’s PVsyst simulations.
PVEL’s scoring methodology is consistent over time.
Click here to view past Scorecards.
An example of a module with high levels of degradation is provided for each reliability test, complete with electroluminescence (EL) images and flash test results on each reliability test result page, and visual inspection images where appropriate.
Not all products or model types are represented in every test. Manufacturers with top results can choose not to be listed in the Scorecard. In some cases, test results were not available at the time of publication.
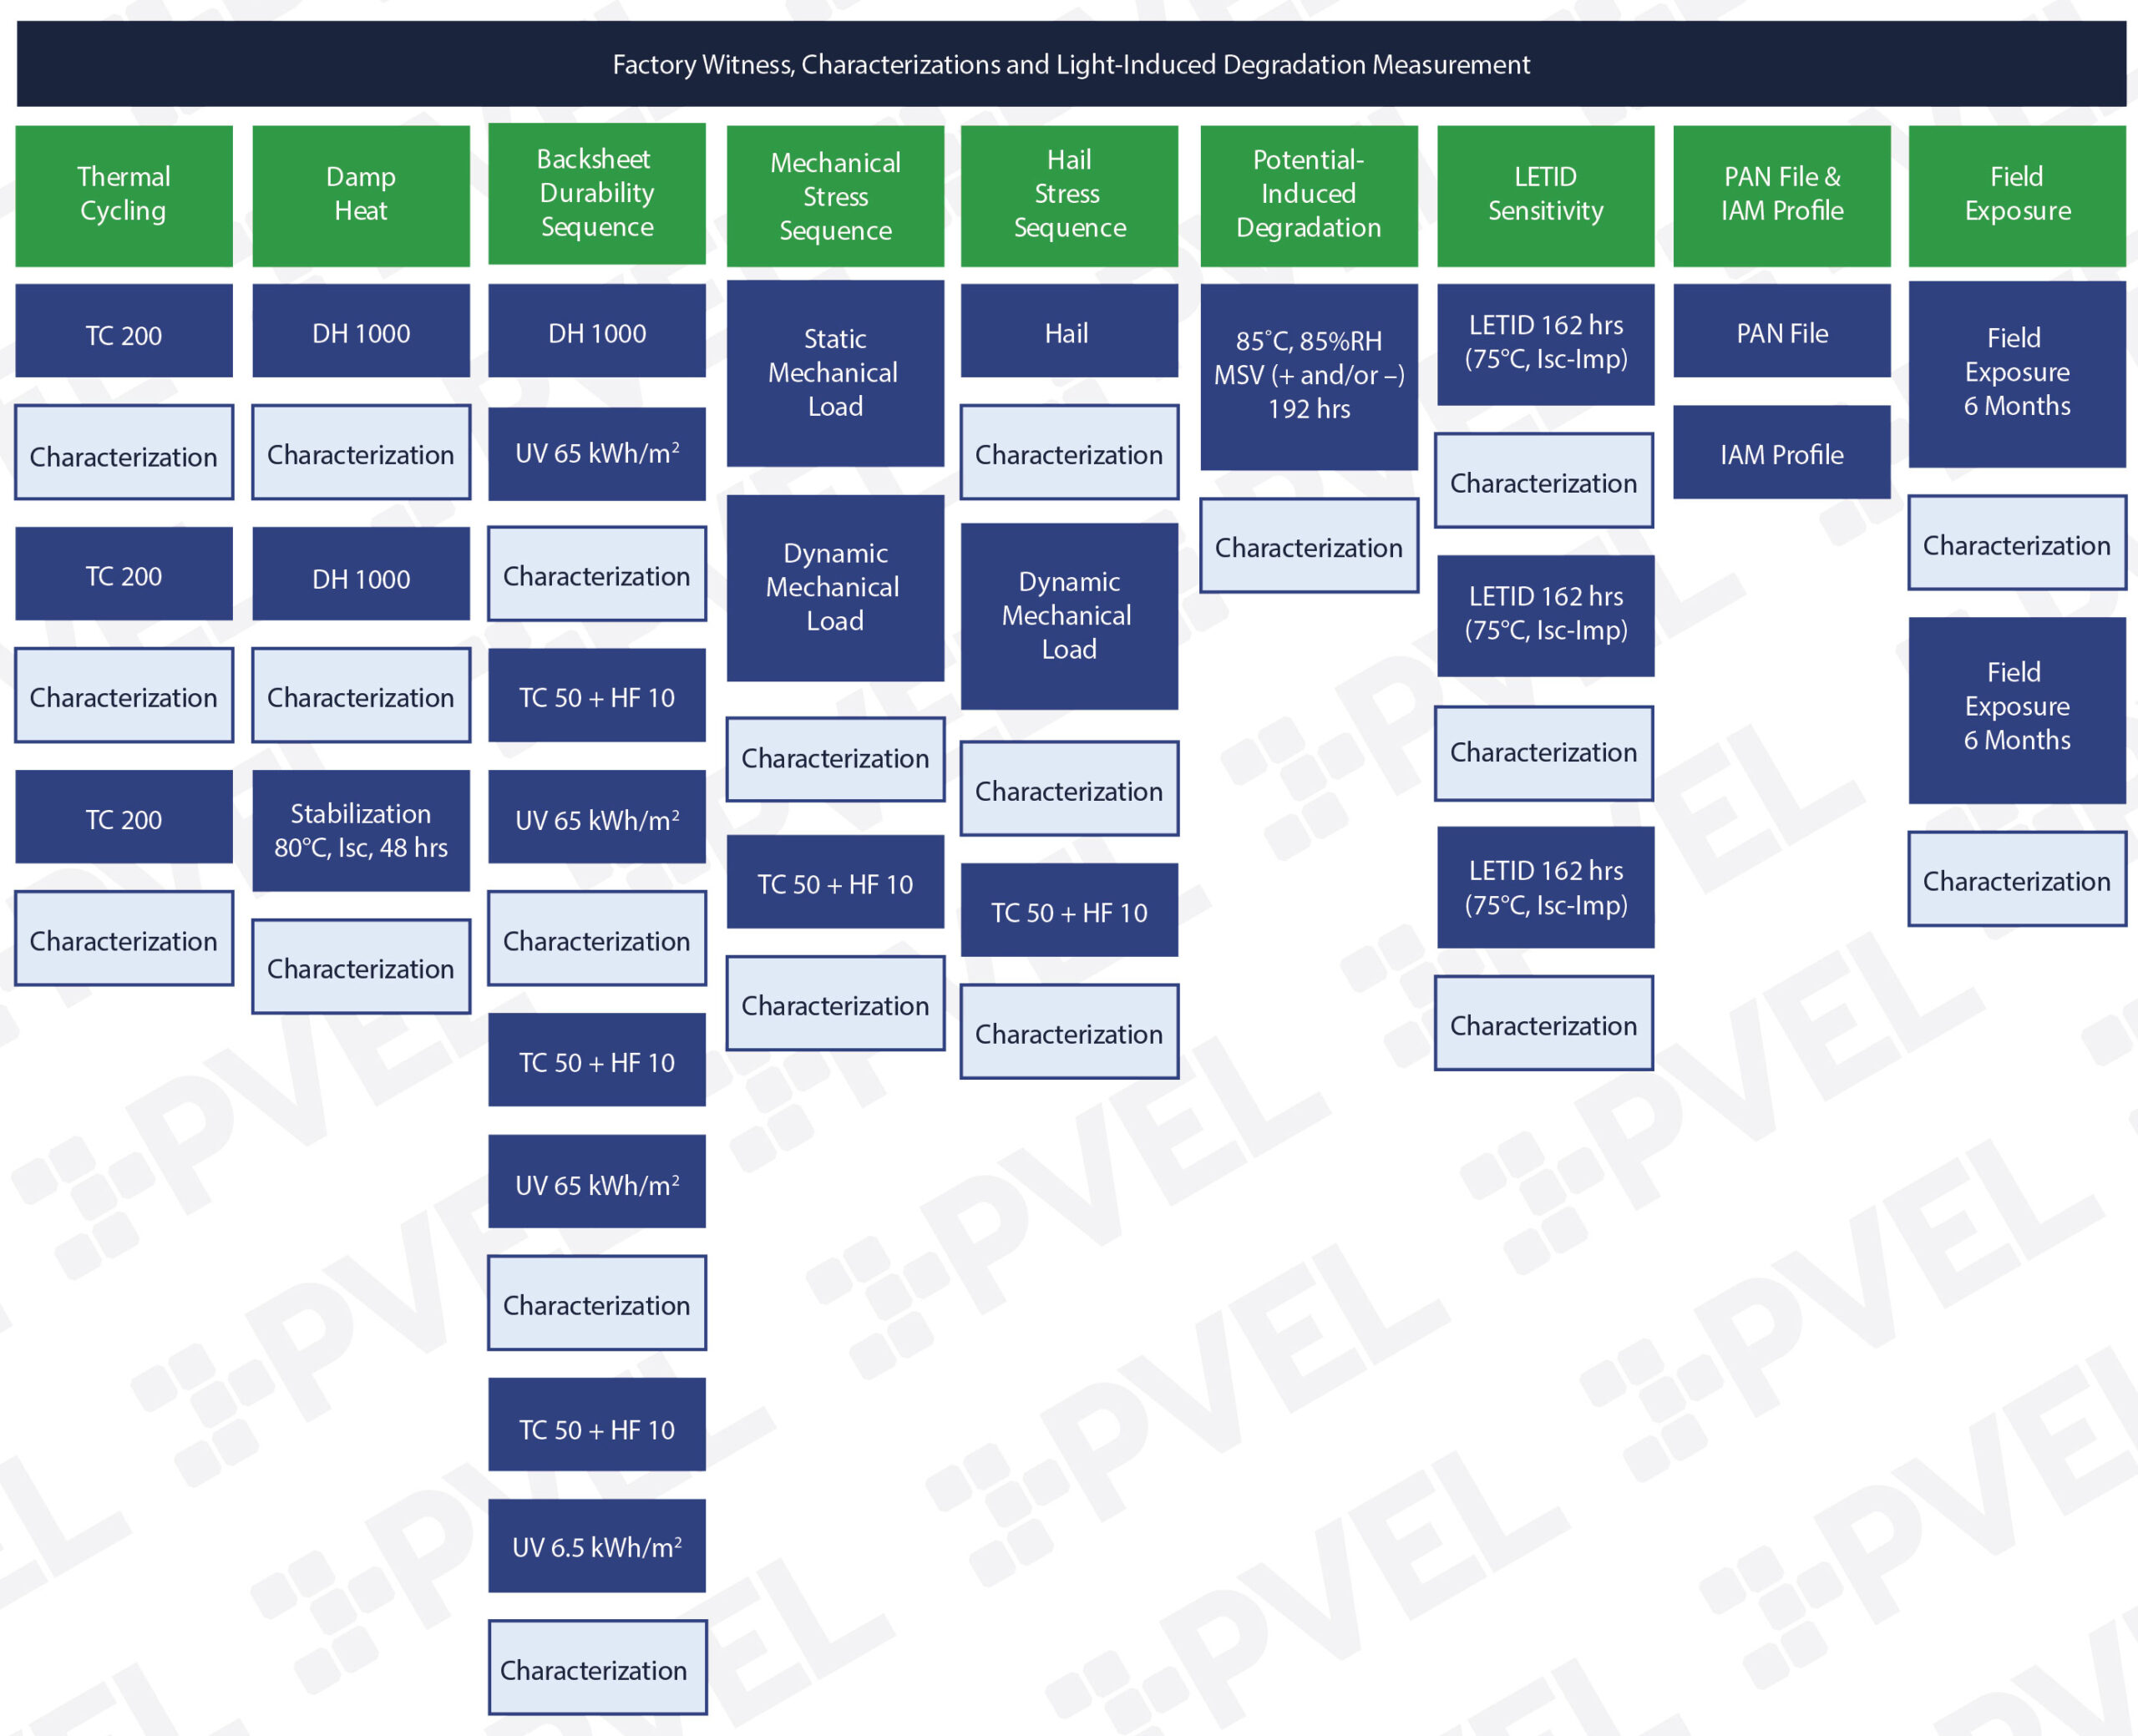
Testing PV Module Reliability and Performance
PVEL’s PV Module PQP is a comprehensive suite of lab and field tests that assess the bankability of PV modules. Click here to view PQP test sequences.
While the specific tests have changed over time, the same four principles have guided PVEL’s PQP since it was first established in 2012:
Empirical Data
The PQP provides empirical metrics for revenue and energy yield modeling.
Standard Processes
The PQP tests all BOMs in the same way with calibrated equipment and in consistent test environments.
No Hand-picked Samples
Auditors witness the production of all test samples and record BOM details.
Regular Program Updates
Test sequence updates provide data on new technologies and manufacturing techniques.
Failures
In a year of successes, PVEL also observed failures in testing for the PV Module Product Qualification Program. While fewer manufacturers experienced a failure this year as compared with the 2021 Scorecard, one quarter of BOMs suffered at least one failure during testing. The greatest number of failures occurred during the damp heat sequence. Explore 2022 failure data to learn more.
Failures in Testing
Fewer manufacturers experienced a failure in testing for the 2022 Scorecard than in 2021. However, the BOM-level failure rate remained the same: 26% of BOMs experienced at least one failure.
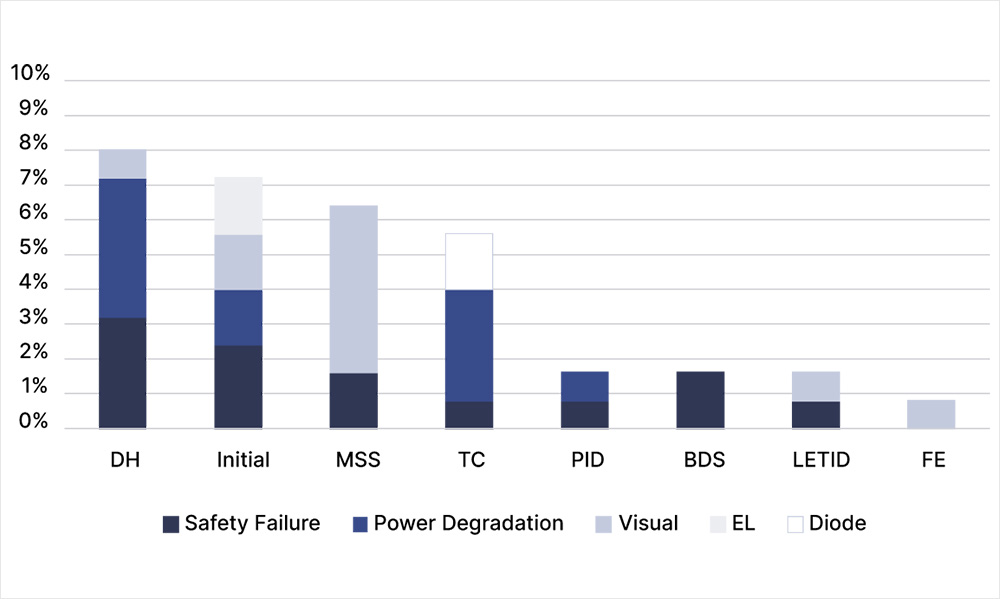
PQP Failure Statistics
This graph shows failures observed in each test sequence of the PQP by type of failure.
The most common type of failure is safety, followed closely by power degradation and visual inspection defects.
Initial failures are those that were detected during intake characterizations prior to testing.
Download the Summary (https://modulescorecard.pvel.com/download-the-scorecard/)
A summary of the 2022 PV Module Reliability Scorecard is available for PDF download. It provides buyers with a quick reference to Top Performers and high-level insights from testing.
Continue exploring the online edition of the Scorecard for a searchable database of Top Performers, profiles of top-performing manufacturers, insights into financial impacts of various tests, and more.
Summarized and translated by Europe Solar Innovation., Co. Ltd.