PV column
Photovoltaic
2022/06/01
“Global Market Outlook For Solar Power 2022-2026” by SolarPower Europe
To learn more about the global solar market and its trends over the next five years, SolarPower Europe has published this year’s edition of “Global Market Outlook for Solar Power 2022-2026.” The market trend of solar power generation is very clearly summarized.
The report (in English) can be downloaded from the link below.
Source: https://www.solarpowereurope.org/insights/market-outlooks/global-market-outlook-for-solar-power-2022
The following is an overview and executive summary of this report.
***********
SolarPower Europe’s annual award-winning Global Market Outlook for Solar Power is the most authoritative market analysis report for the global solar power sector.
With comprehensive historical market data, 5-year forecasts for the key global markets, as well as analysis of the segmentation between rooftop and ground-mounted systems, this report is an indispensable tool for the solar industry and energy stakeholders alike.
Download the Global Market Outlook 2022-2026 and discover:
- The global solar market
- Trends: what’s hot in solar technology
- Highlight: Solar potential in Latin America
- GW-scale solar power markets in 2021
- Global Market Outlook for Solar Power 2022-2026
—————————————————————————–
Key Takeways
1. Global solar hits Terawatt mark
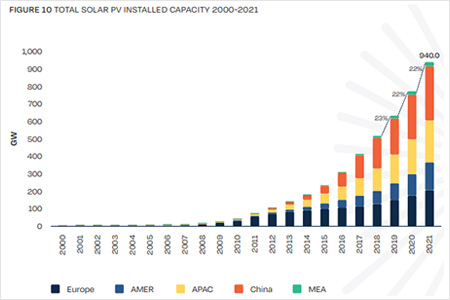
Global solar capacity doubled in 3 years from 2018, bringing the world’s solar fleet to one Terawatt capacity in April 2022. The global solar market is growing exponentially. It took around a decade for world-wide solar capacity to reach 1 TW, from 100 GW in 2012. In just 3 years, SolarPower Europe predicts global solar to more than double to 2.3 TW in 2025.
2. Solar: the fastest growing energy technology
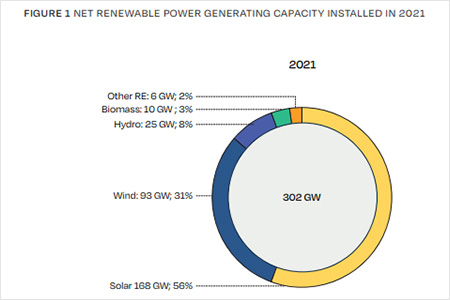
Solar remains the fastest growing renewable energy, representing over half of the 302 GW of renewable capacity installed internationally in 2021. With 168 GW of additions, solar installed over 70 GW more than the next greatest installer – wind – and more than all non-solar renewables combined.
3. Global solar shares
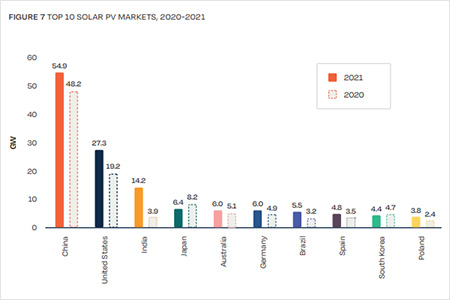
With a 14% annual growth rate and an all-time high of 54.9 GW of new solar, China kept its market leadership in 2021, adding twice as much solar power capacity than the second-largest market, the United States. The United States nonetheless saw impressive growth, with 42% more additional solar in 2021 than 2020. India reclaimed it’s third position with 14.2 GW of solar installations.
4. European solar trajectory
The Europe region* continued its positive solar trajectory, achieving 31.8 GW of additional solar capacity – representing 33% growth and notably only a 0.1 GW difference to our 2021 Global Market Outlook projections. The impact of the Russian war on Ukraine, and the accompanying energy security challenges, alongside EU climate goals, are driving the continent’s renewable transition – with 25 of 27 EU member states set to install more solar in 2022 than 2021.
*Europe region = EU27 + Albania, Armenia, Azerbaijan, Belarus, Bosnia and Herzegovina, Georgia, Iceland, Kosovo, Montenegro, North Macedonia, Norway, Russia, Serbia, Switzerland, Turkey, Ukraine, and the United Kingdom.
Source: https://www.solarpowereurope.org/insights/market-outlooks/global-market-outlook-for-solar-power-2022
**********
Please refer to the executive summary of this report as follows:
Executive summary
In a year characterised by continuing COVID-19 waves and economic recovery programmes, as well as an energy crisis that saw record-high electricity prices around the world, many turned to solar solutions for their energy needs. In 2021, 167.8 GW of solar capacity was grid-connected globally, a 21% growth over the 139.2 GW added the year before, establishing yet another global annual installation record for the sector. This brings the total operating solar fleet to 940 GW by the end of 2021, with the Terawatt milestone already achieved ahead of the publication of this Outlook in May 2022.
This remarkable growth has no match among any other power generation technology. Out of the over 300 GW of new global renewable power generating capacity, solar alone installed more capacity than all other renewable technologies combined, claiming a share of 56%. Solar also deployed more capacity than all fossil fuel power generation technologies together in 2021. At the same time, however, solar still meets only a small share of around 4% of the global electricity demand, while over 70% is provided by non-renewable sources.
Challenges across the supply chain did not stop the progress of solar’s cost competitiveness. With a further 3% decrease compared to the previous year, today the cost of utility-scale solar is consistently lower than any range of new conventional power generation sources, while the cost-competitiveness of solar + storage versus gas peakers is already undisputable in certain regions.
Solar tender results provide testimony for the growing competitiveness of solar technology around the world, with new record-low solar tariffs registered again in 2021. Solar’s new lowest bid of 1.04 USD cents in Saudi Arabia was 21% lower than the previous record set in Portugal in 2020.
With a 14% annual growth rate and an all-time high 54.9 GW new solar, China kept its market leadership in 2021, adding twice as much solar power capacity than the second-largest market, the United States, which continued its remarkable growth performance with a 42% annual expansion. After a disappointing year in 2020, India reclaimed the third position with 14.2 GW installed. The record solar years in both China and India were not high enough to maintain the Asia-Pacific region’s global share, which lost 6 percentage points to 56%, while the Americas and Europe grew to 22% and 19% respectively.
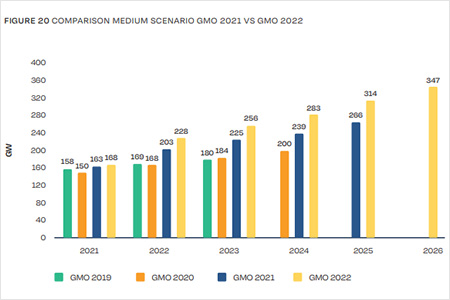
Despite the increase in solar component and freight prices that affected the sector in 2021 extending into 2022, this year we expect another record-breaking performance. In 2022 our Medium Scenario anticipates additional global solar installation capacities to increase by 36% to 228.5 GW. The world will see very strong demand for solar in the next four years, growing from 255.8 GW additional capacity in 2023 to 347 GW in 2026. It will most likely add 314.2 GW in 2025, 18% more than we anticipated in last year’s Global Market Outlook.
If it took 10 years to upscale the world’s total grid-connected solar capacity from 100 GW in 2012 to 1 TW in 2022, it will take only a little more than 3.5 years to double it to 2 GW by end of 2025. At the end of our forecasting period, we expect 2.3 TW of solar to be installed worldwide.
Despite the global market growth, the number of markets in the GW range has remained 17 in 2021, although sustained growth is expected on this front, too – we forecast 21 GW markets in 2022, 29 in 2023 and 34 in 2024.
This year’s regional focus is on Latin America. With the support of the Global Solar Council (GSC), we have provided an in-depth analysis of solar in a market that grew 44% in 2021 thanks to exciting developments in its GW-scale markets Brazil and Chile. The future for solar in the region looks promising, particularly in Brazil, which, for the first time, has entered the top 10 of the prospected largest solar markets over the 5-year report outlook period. Brazil is expected to install 54 GW by 2026, that’s comparable to Germany’s – Europe’s largest solar market – level of installations, until recently.
Source: https://www.solarpowereurope.org/insights/market-outlooks/global-market-outlook-for-solar-power-2022