
PV column
energy
2026/10/08
Australian Energy Statistics – 2026 edition
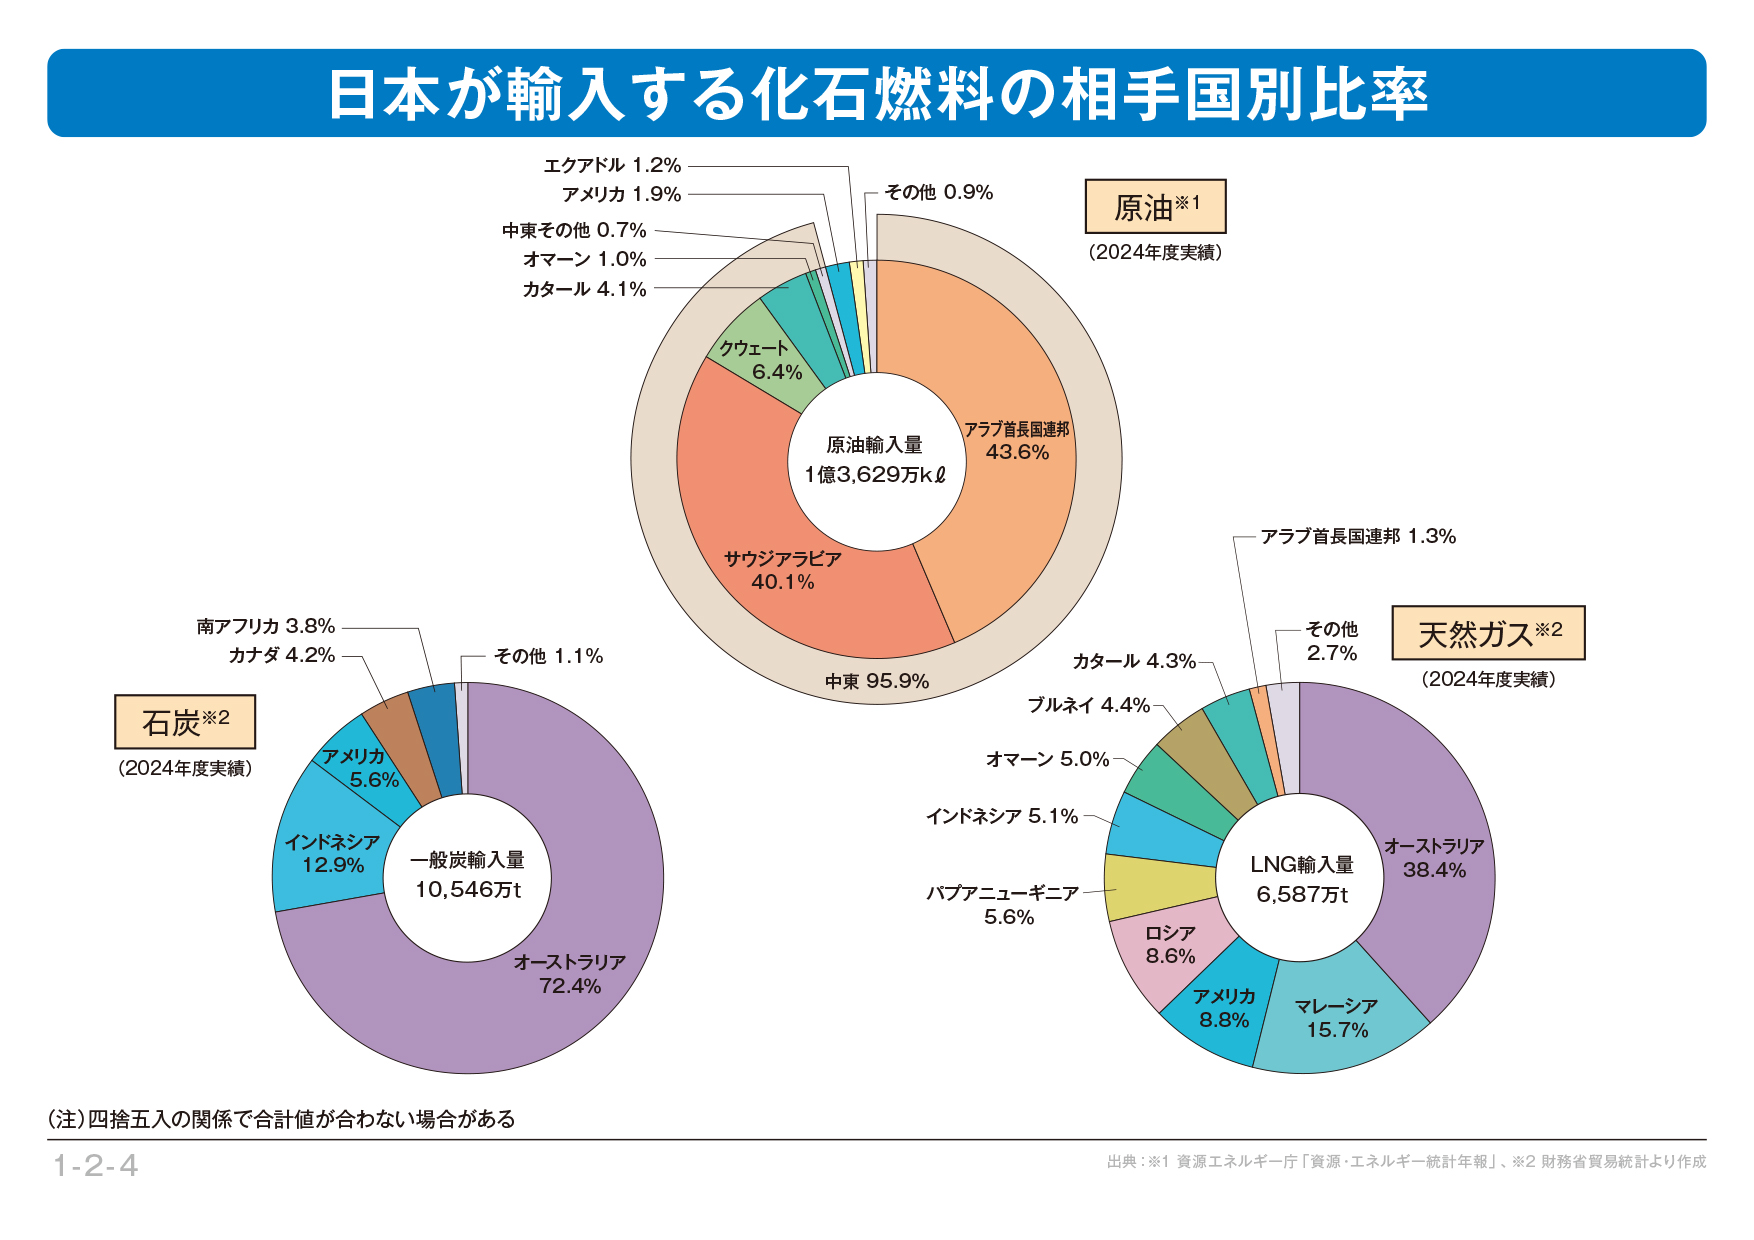
Japan relies on imports for almost all of its fossil fuel energy supplies. While crude oil imports are heavily concentrated in the Middle East (97.5%), sources for natural gas (LNG) are diversified, including Australia (40%), Malaysia (15%), and the United States and Russia (approximately 8% each). As for coal, Australia accounts for about 70% of total imports.
Figure 1. Breakdown of Japan’s fossil fuel imports by country of origin:
Australia, a major source of natural gas and coal imports, is not only an exporter of these fossil fuels but also a leader in the adoption of renewable energy and energy storage systems. The Australian Department of Climate Change, Energy, the Environment and Water has released the “Australian Energy Statistics – 2026 Edition,” which incorporates data through the 2024–25 fiscal year.
In this column, we introduce the executive summary from this report (53 pages in total).
Source: Department of Climate Change, Energy, the Environment and Water, Australian Energy Statistics – 2026 edition
https://www.energy.gov.au/news/australian-energy-statistics-2026-edition
**********
Australian Energy Statistics – 2026 edition
25 September 2026 9:11am
The Australian Energy Statistics has been released with updated statistics to 2024-25.
This is the authoritative and official source of energy statistics for Australia. It is updated each year and includes detailed data on:
- historical energy consumption
- production and trade of energy
- energy balances.
The statistics cover all types of energy and all parts of the economy.
**********
Executive summary
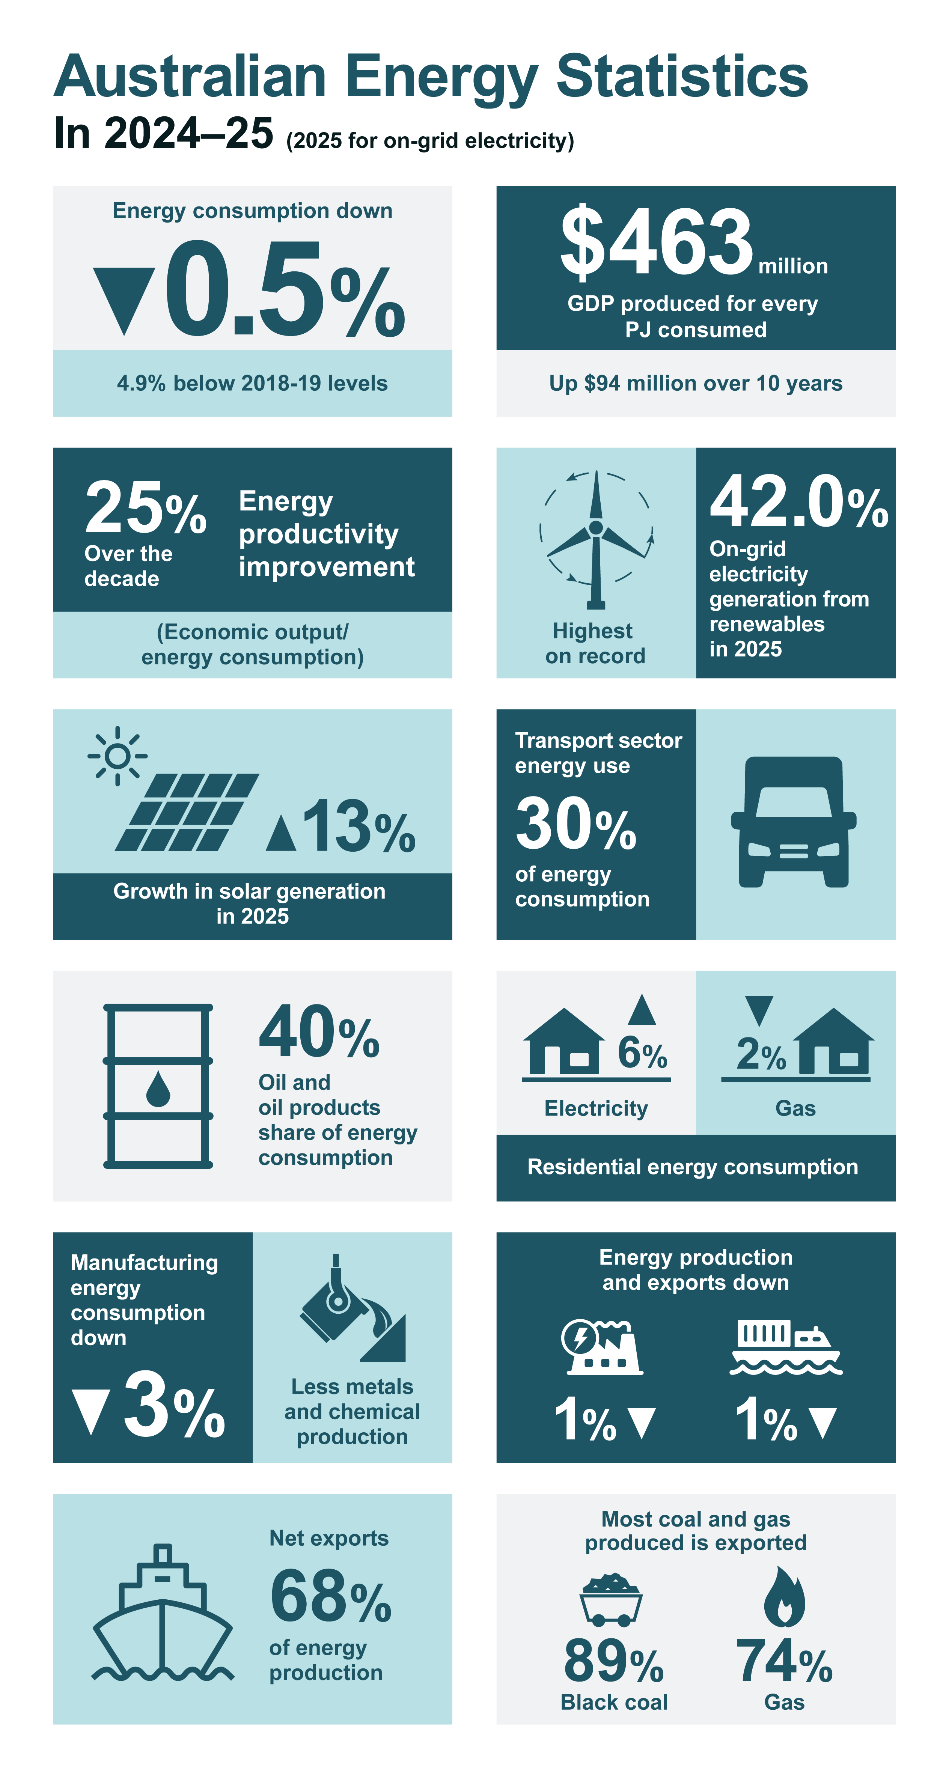
- Australia’s energy consumption fell 0.5 per cent in 2024–25
- Two-thirds of Australian energy production is exported, including most coal and gas
- Renewable electricity generation at record levels, 42.0 per cent of on-grid generation in 2025
- Transport remained the largest energy user, with residential consumption also rising
- Over 80 per cent of refined petroleum product consumption was sourced from imports
Figure 2. Australian Energy Statistics:
https://www.energy.gov.au/news/australian-energy-statistics-2026-edition
Energy consumption
- The Australian economy grew 1.4 per cent in 2024–25 to $2.7 trillion. Population grew 1.5 per cent to reach 27.6 million people.
- Australia’s energy consumption fell 0.5 per cent in 2024–25 to 5,872 petajoules. Consumption was 4.9 per cent below the historical peak of 6,174 petajoules in 2018–19.
- Compared to the peak, energy consumption in 2024–25 was 302 petajoules lower: the same amount of energy obtained from filling a 55-litre tank of petrol 160 million times.
- Energy productivity continues to rise. Energy productivity, as measured by gross domestic product (GDP) divided by energy consumption, improved 1.9 per cent in 2024–25. Australia now creates $462.6 million in GDP for every petajoule of energy consumed, 25.5 per cent more than a decade ago.
- Energy use in the transport sector, the largest energy consumer, rose 0.4 per cent to the highest level on record in 2024–25. Air transport was the main source of growth.
- Energy use in the electricity supply sector continued a long-term downward trend, falling 1.9 per cent in 2024–25 despite increased electricity generation. This reflects a shift from fossil fuel generation to more efficient renewable power.
- Energy use fell 2.8 per cent in manufacturing, impacted by lower alumina production and reduced refinery consumption. However, ferrous metals energy use rose 7.1 per cent as iron and steel sector activity returned to higher levels.
- Mining energy use fell 0.5 per cent, largely due to unplanned maintenance in Northern Territory LNG operations.
- Commercial and services sector energy use remained relatively stable, while residential sector energy consumption grew 2.4 per cent in 2024–25. Residential energy use shows signs of an ongoing shift from gas to electricity, with gas consumption declining by 2.3 per cent and electricity consumption rising by 6.2 per cent.
- Coal consumption fell 2.7 per cent in 2024–25. Almost 9 tenths of coal consumption is used for coal-fired electricity generation, which continued to decline in 2024–25.
- Oil remained Australia’s largest source of primary energy consumption, at 40.1 per cent of the total, and gas and coal were each around a quarter of the primary energy mix.
- Total final energy consumption grew 0.1 per cent. This equates to total demand by end users, excluding energy losses and energy spent in conversion and delivery activities. This small rise in end use consumption contrasts with the decline in total energy consumption, reflecting that less energy was lost or spent in delivering energy to consumers.
- Over half of final consumption is oil products, and around 22 per cent is electricity. Renewable energy made up a record 13.1 per cent of final consumption – 8.4 percent renewable electricity and 4.7 per cent direct use of renewable energy such as solar hot water and wood.
Energy production
- Energy production fell 0.9 per cent in 2024–25 to 18,870 petajoules, with fossil fuels production falling across the board and renewables rising 7.0 per cent.
- Black coal production was 11,179 petajoules (419 million tonnes), falling 0.3 per cent, influenced by ongoing adverse weather impacts. Black coal is by far Australia’s largest source of energy production, and mostly bound for export (88.9 per cent in 2024–25).
- Natural gas production fell 2.0 per cent to 5,999 petajoules in 2024–25, partly due to the retirement of a train at North West Shelf LNG plant and lower export demand.
- Crude oil and condensate production fell 4.6 per cent in 2024–25, and naturally-occurring LPG production fell 4.9 per cent. These fuels are relatively minor in Australian energy production.
- Primary renewable energy production increased 7.0 per cent. While solar electricity production continues to expand rapidly, bioenergy production fell 2.3 per cent and hydro power output fell by 5.9 per cent.
Electricity generation
- Total electricity generation in Australia rose 1.3 per cent in 2024–25 to 282.5 terawatt hours (1,017 petajoules). This figure includes industrial onsite generation, rooftop solar PV and off-grid generation.
- Renewable generation increased 9.5 per cent in 2024–25, contributing 37.6 per cent of total generation (106.2 terawatt hours), an increase of three percentage points.
- Renewable generation in Australia grew further in calendar year 2025, to 39.6 per cent of total generation (113.6 terawatt hours), the highest on record. In calendar year 2025, solar generation constituted 19.7 per cent of total generation and wind 14.0 per cent.
- More than 21 per cent of Australia’s electricity was generated outside the electricity supply sector by industry and households in 2024–25, including 8.8 per cent by the mining and manufacturing sectors and 11.8 per cent from small-scale solar PV.
- On-grid generation in 2025 was around 92 per cent of total generation and renewables accounted for 42.0 per cent of on-grid generation. 77.5 per cent of off-grid generation was natural gas-fired, with three quarters of oil-fired generation also occurring off-grid.
- Fossil fuel generation declined 3.1 per cent in 2024–25, with coal-fired and gas-fired generation falling 3.7 per cent and 1.1 per cent, respectively.
- Coal-fired generation remained the dominant source of electricity generation in Queensland, New South Wales and Victoria. However, its share of total generation continued to decline, falling 2.5 percentage points to be 42.7 per cent of Australian electricity generation,
- Natural gas-fired generation fell to its lowest level in a decade. It is strongly concentrated in Western Australia which had 56.5 per cent of Australian gas-fired generation. However, the gas share of total Western Australian electricity fell 2.1 percentage points to 57.4 per cent.
Energy trade
- The majority (79.9 per cent) of Australia’s energy production is exported and Australia exports much more energy than it imports. Net exports (exports minus imports) were equal to about two thirds of production in 2024–25.
- Energy exports fell 1.5 per cent in 2024–25 to 15,067 petajoules. Black coal and LNG make up over 95 per cent of Australia’s energy exports and most output of these products is exported.
- Black coal exports fell 1.2 per cent, largely due to wet weather and incidents at coal mines disrupting production and exports through coal terminals.
- LNG exports declined 1.8 per cent to 4,425 petajoules, down from a record high in 2021–22.
- Exports of crude oil/condensate fell 4.8 per cent and LPG exports 9.3 per cent. Both fuels are partially sourced from gas extraction sites.
- Energy imports declined slightly by 0.4 per cent to 2,311 petajoules in 2024–25. Refined products and crude oil are by far Australia’s largest energy imports.
- Crude oil imports rose slightly 0.3 per cent while refined product imports fell 0.4 per cent, as demand weakened. 80.8 per cent of refined petroleum product consumption was met by imports in 2024–25.
About the Australian Energy Statistics
The Australian Energy Statistics (AES) is the authoritative and official source of energy statistics for Australia, covering all types of energy and all parts of the economy. It is updated annually, providing information on energy supply and use in Australia to support decision making in government, industry and more broadly. AES data is also used to meet annual international energy reporting obligations and support the calculation of greenhouse gas emissions.
The AES provides detailed statistics and balances of energy consumption, production and trade; by state and territory, fuel and industry; in energy content units and volume or mass units. Concepts, definitions and presentation align as closely as possible with the framework used by the International Energy Agency (IEA).
Key data sources include facility level reporting from the National Greenhouse and Energy Reporting Scheme (NGERS); the Australian Petroleum Statistics (APS); the Resources and Energy Quarterly; datasets and estimates from other Australian and state government agencies; internal estimates using statistical techniques; and public company reporting. Some datasets from private subscription services and industry associations are also used to compare with these estimates and sources.
The AES has been published by the Department of Climate Change, Energy, the Environment and Water (DCCEEW) from 2022, and various previous Australian government agencies since the mid‑1970s.
The AES dataset is available online in Excel and CSV formats. A list of the AES Excel tables available on the energy.gov.au website is provided in Table 1. An energy flows schematic is also available on the website, as is an interactive dashboard containing electricity statistics.
This annual report, the Australian Energy Update, highlights recent trends in Australian energy consumption, production, and trade.
The Guide to the Australian Energy Statistics published in conjunction with this report, assists users in better understanding the AES and supports the transparency of the dataset. It contains information on definitions and concepts, data sources and methodology, conversion factors, confidentiality, and historical revisions.
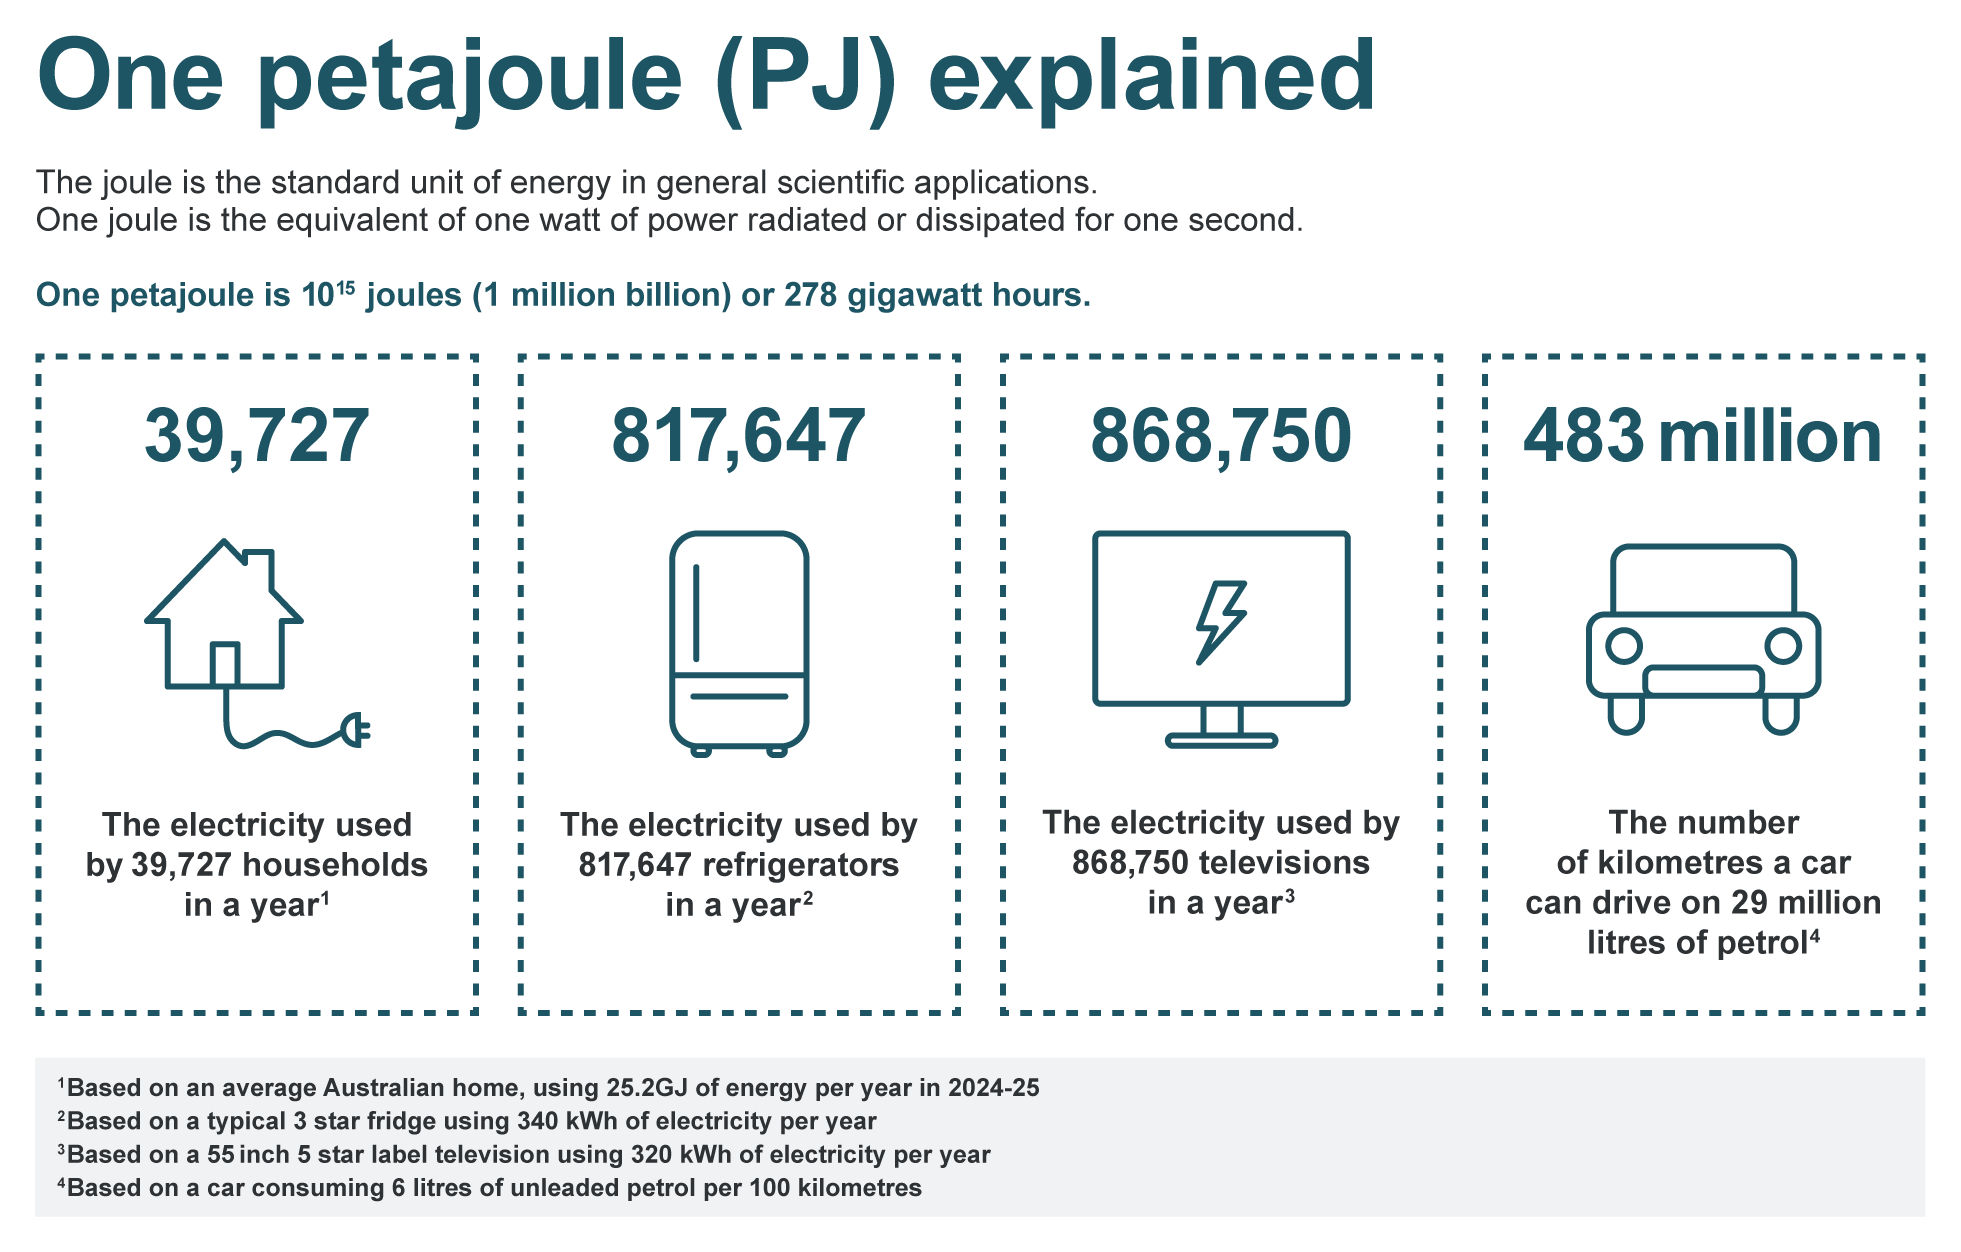
The main unit of energy in the AES is the petajoule (PJ). One petajoule = 1 x 10¹⁵ joules. One petajoule, or 278 gigawatt hours, is the heat energy content of about 43,000 tonnes of black coal or 29.2 million litres of petrol. One petajoule is equivalent to filling up a car with a fuel tank capacity of 55 litres of petrol around 532,000 times. A car using 6 litres of petrol per hundred kilometres could drive approximately 483 million kilometres on one petajoule, more than three times the distance from the Sun to the Earth.
Figure 3. One petajoule (PJ) explained:
https://www.energy.gov.au/news/australian-energy-statistics-2026-edition
**********
Even in Australia—a nation rich in energy resources—the adoption of renewable energy and energy storage systems is actively progressing, signaling a shift in the primary power source from fossil fuels to renewable energy.
To ensure that issues regarding development and administrative procedures are not conflated with broader energy strategy in Japan, as a company specializing in renewable energy, we are committed to contributing to the creation of an environment that enables a comprehensive overview of renewable energy and energy storage systems.
Acknowledgments: We would like to express our gratitude to the Australian Department of Climate Change, Energy, the Environment and Water for publishing interesting statistics, and to the Japan Atomic Energy Relations Organization for compiling the easy-to-understand graphs.