
PV column
Photovoltaic
2026/09/09
“Global Market Outlook for Solar Power 2026-2030” by SolarPower Europe
To learn more about the global solar market and its trends over the next five years, SolarPower Europe has published this year’s edition of “Global Market Outlook for Solar Power 2026-2030” on June 22, 2026. The market trend of solar power generation is very clearly summarized.

The report (in English) can be downloaded from the link below.
Source: https://www.solarpowereurope.org/insights/outlooks/global-solar-market-outlook-2026-2030
This column provides an introduction and executive summary of this report.
**********
00 Foreword
Welcome to the Global Market Outlook for Solar Power 2026-2030
One could almost take it for granted that solar is breaking deployment records year after year. And indeed, the global solar power fleet passed the 3 TW milestone in early 2026, less than two years after reaching 2 TW and only four years after entering the terawatt era. What is even more impressive is that solar now supplies 9% of global electricity demand – three times as much as just five years ago.
In 2025, the world installed a record 664 GW of new solar capacity, a 12% increase over the previous year. Once again, solar was by far the largest contributor to new renewable power generation worldwide, accounting for around 80% of renewable capacity additions. It also outpaced the combined additions of fossil fuel and nuclear power generation. These remarkable achievements reflect the extraordinary pace at which solar has become the backbone of the global energy transition.
But now is not the time for complacency.
In an increasingly uncertain geopolitical and economic environment, shaped by repeated energy security crises and fossil fuel price volatility, solar paired with battery storage is becoming more important than ever. No other technologies can deliver affordable, resilient and rapidly deployable energy at scale while simultaneously strengthening national and individual energy security. This edition therefore includes a dedicated chapter exploring the growing relationship between solar deployment, energy independence and resilience.
The solar message is crystal clear: the technology is ready for much more, the economics are compelling, and the strategic rationale has never been stronger
Yet a closer look at the numbers reveals that the industry is entering a new phase. While solar continues to grow, the pace of expansion is moderating. We expect the global market to contract by 8% in 2026, primarily due to a projected 24% decline in China following major changes to its solar market design. The rest of the world keeps mostly growing, but, as the world’s dominant solar market, developments in China inevitably shape global trends.
Looking ahead, growth remains firmly on the horizon. Under our Medium Scenario, global solar capacity is forecast to more than double to 6.6 TW by 2030. Impressive at first sight, this represents a downward revision from last year’s forecast of 7.1 TW, reflecting the structural constraints that increasingly accompany solar’s success. Grid congestion, insufficient storage, limited system flexibility, permitting delays, financing barriers and supply-chain resilience are already key challenges hampering further growth.
For this reason, the Global Solar Council has expanded its policy recommendations. In addition to longstanding priorities, governments should integrate solar into national energy security strategies and accelerate the deployment of battery storage, recognising its dual role in strengthening resilience and providing system flexibility.
The case of Australia, our region in focus this year and the upcoming COP31 co-host, demonstrates the benefits of strategic investment in storage, showing how even a very mature solar market can continue to unlock new opportunities. Policy support has triggered an unprecedented battery storage boom in the country already home to the highest per-capita solar deployment globally, adding more than 10 GWh of residential storage in less than a year and beginning to decrease gas generation during evening peak demand periods.
If more countries follow the Australian approach, our High Scenario could turn into reality, pointing to over 15% additional upside potential, with the global solar fleet reaching 7.6 TW by 2030. That pathway becomes increasingly achievable, and could be even conservative, if governments accelerate electrification, modernise power systems and draw the appropriate lessons from the recent fossil fuel energy crises.
The COP31 Presidency’s proposal for a 35% global electrification target sends a strong and positive signal. At the same time, promising solar developments in Southeast Asia in response to the latest fossil fuel crisis in particular highlight the region’s growing momentum. Home to more than half of the world’s population and heavily dependent on imported fossil fuels, the region has a unique opportunity to strengthen both its energy security and economic competitiveness through solar and storage deployment.
The solar message is crystal clear: the technology is ready for much more, the economics are compelling, and the strategic rationale has never been stronger. The task now is to ensure that policy frameworks keep pace with the extraordinary momentum of solar and battery storage. If they do, the next terawatts will arrive even sooner than currently expected.
Finally, we would like to thank the national solar and renewable energy associations that contributed their expertise and market intelligence to this report. Their insights and feature articles help make the Global Solar Market Outlook a unique and comprehensive assessment of solar market developments around the world.
Enjoy reading our report.
**********
01 Executive summary
Introduction
A record 664 GW of new solar PV capacity was added in 2025 despite growth slowing to 12%; Asia-Pacific reached 73% annual market share
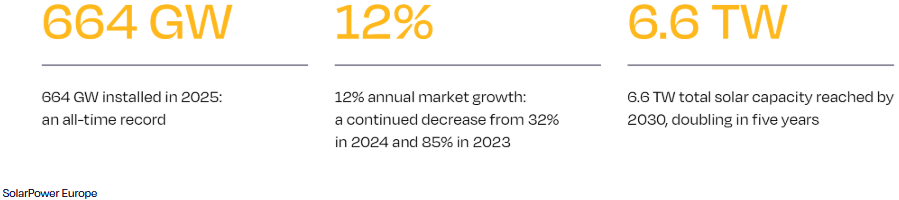
The global solar market reached a new record in 2025, with 664 GW of new installed capacity (Fig. 1). This represents an increase of 69 GW compared with 2024 and 212 GW compared with 2023. However, although the market continues to set new records, growth is steadily slowing, from 85% in 2023 to 32% in 2024 and 12% in 2025. Despite this deceleration, solar PV remained the leading driver of the global energy transition in 2025, accounting for 77% of all renewable capacity additions and reaching 2,778 TWh of generated electricity. Solar’s share of global electricity production rose to 9%, doubling in just four years and surpassing wind power for the first time.
The Asia-Pacific region was more than ever the engine of global solar growth. It accounted for 73% of worldwide additions, with 487 GW installed in 2025, representing annual growth of 17%, well above the global average of 12%. Europe became the second-largest market, adding 81.6 GW, recording a modest 3% growth. The Americas ranked third, with 43.2GW and accounting for 12% of global addition, but were the only region to experience a year-on-year decline, with installations falling by 13%. Meanwhile, the Middle East and Africa remained the smallest regional market, adding 23.7 GW, yet recorded the fastest growth rate, with installations increasing by 51% compared with 2024.
In total capacity terms, the world reached 2.9 TW of operating solar PV systems at the end of 2025. This corresponds to a doubling of the solar fleet in three years, and a tripling in four years.
FIGURE 1
China extends its dominance to a record 57% annual market share, while India emerges as the world’s second-largest solar market
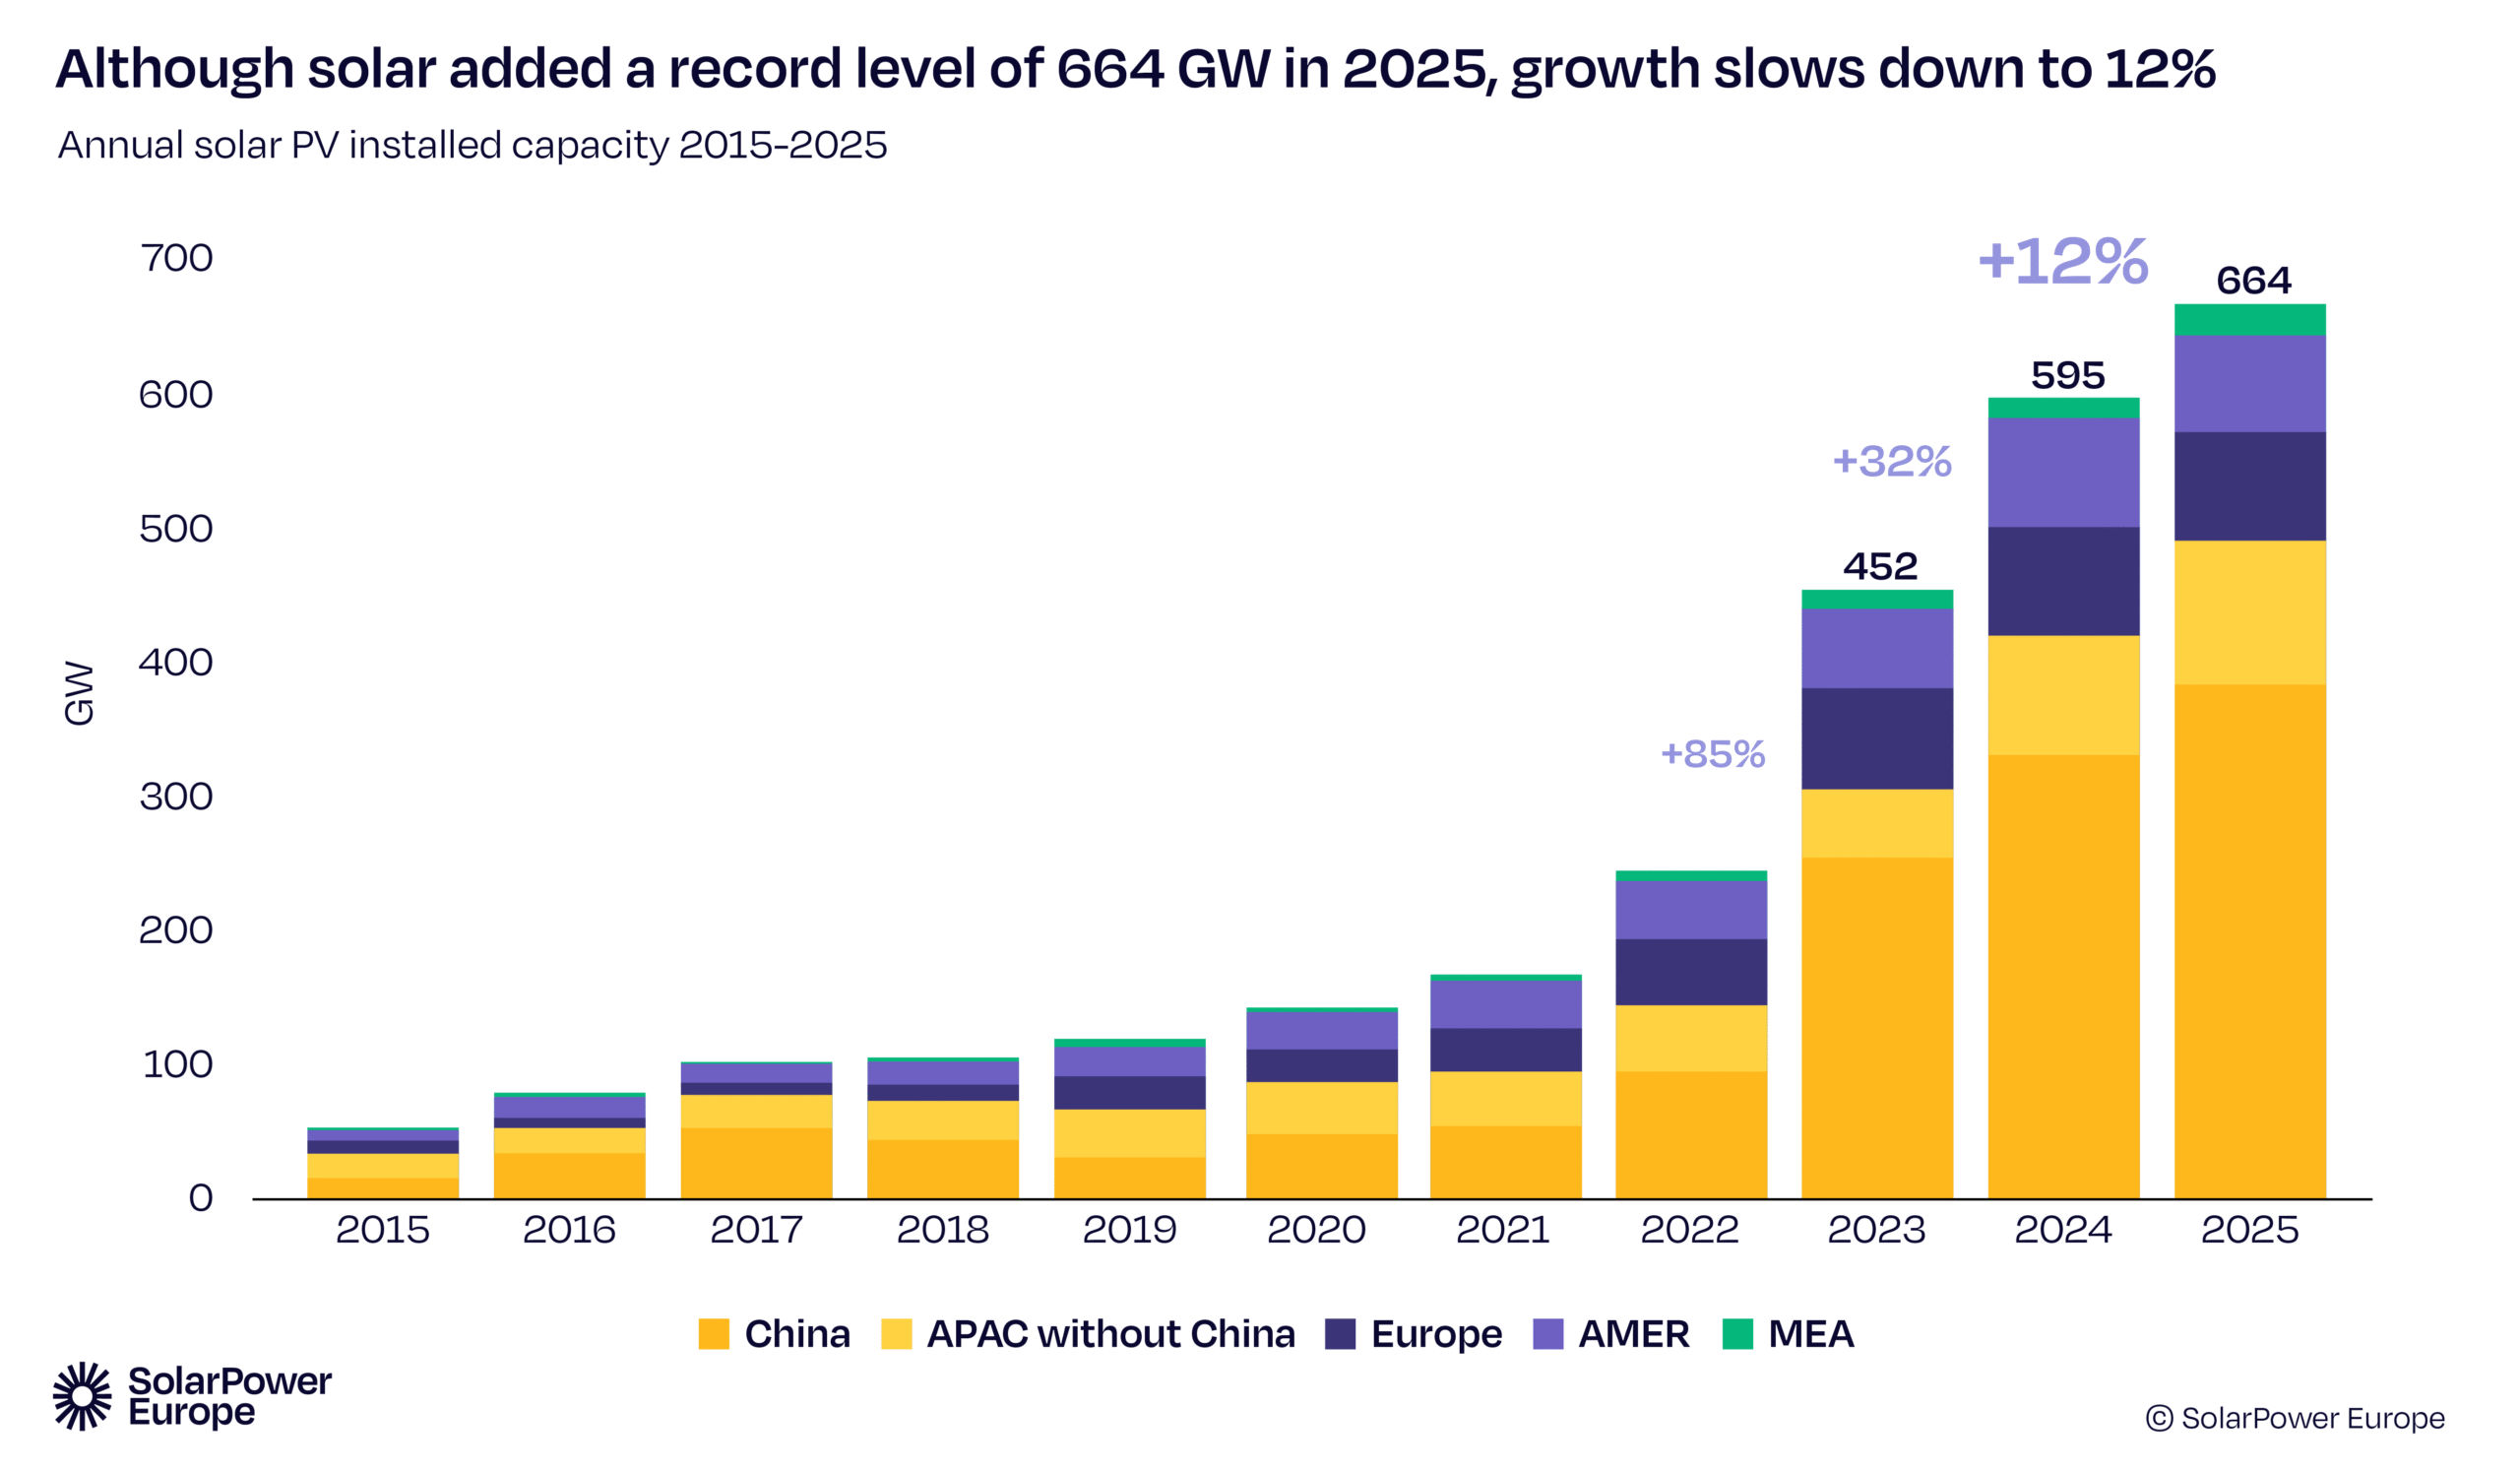
The global solar market remained highly concentrated in 2025, with the top 10 countries accounting for 82% of all newly installed capacity worldwide, one percentage point more than in 2024 (Fig. 2). China further reinforced its dominant position, adding a record 382 GW and representing 57% of global installations. For the third consecutive year, China alone installed more solar capacity than all other top 10 markets combined.
The most notable shift in the rankings was India’s rise to second place. With 45.7 GW of new installations and annual growth of 49%, India overtook the United States and strengthened its position as the world’s leading growth market outside China. Despite a 14% decline to 43.2 GW, the United States was the third-largest market in 2025. Germany climbed to fourth place with 17.4 GW, overtaking Brazil, which saw installations drop to 14.5 GW. Spain retained sixth position with 11.3 GW of new capacity. Saudi Arabia emerged as one of the year’s standout performers, tripling its annual installations to 8.4 GW and securing seventh place. It was the only country from the Middle East and Africa (MEA) region represented in the global top 10.
The threshold for entering the global top 10 increased from 4.7 GW in 2024 to 5.8 GW in 2025, reflecting the continued expansion of solar deployment across a growing number of markets.
Notably, as a single market, the European Union ranked second globally, adding 67.2 GW in 2025 and representing a 10% market share.
FIGURE 2
In 2026 the global solar market is expected to decline for the first time in two decades, with an 8% drop to 612 GW; but the long-term growth trajectory remains intact
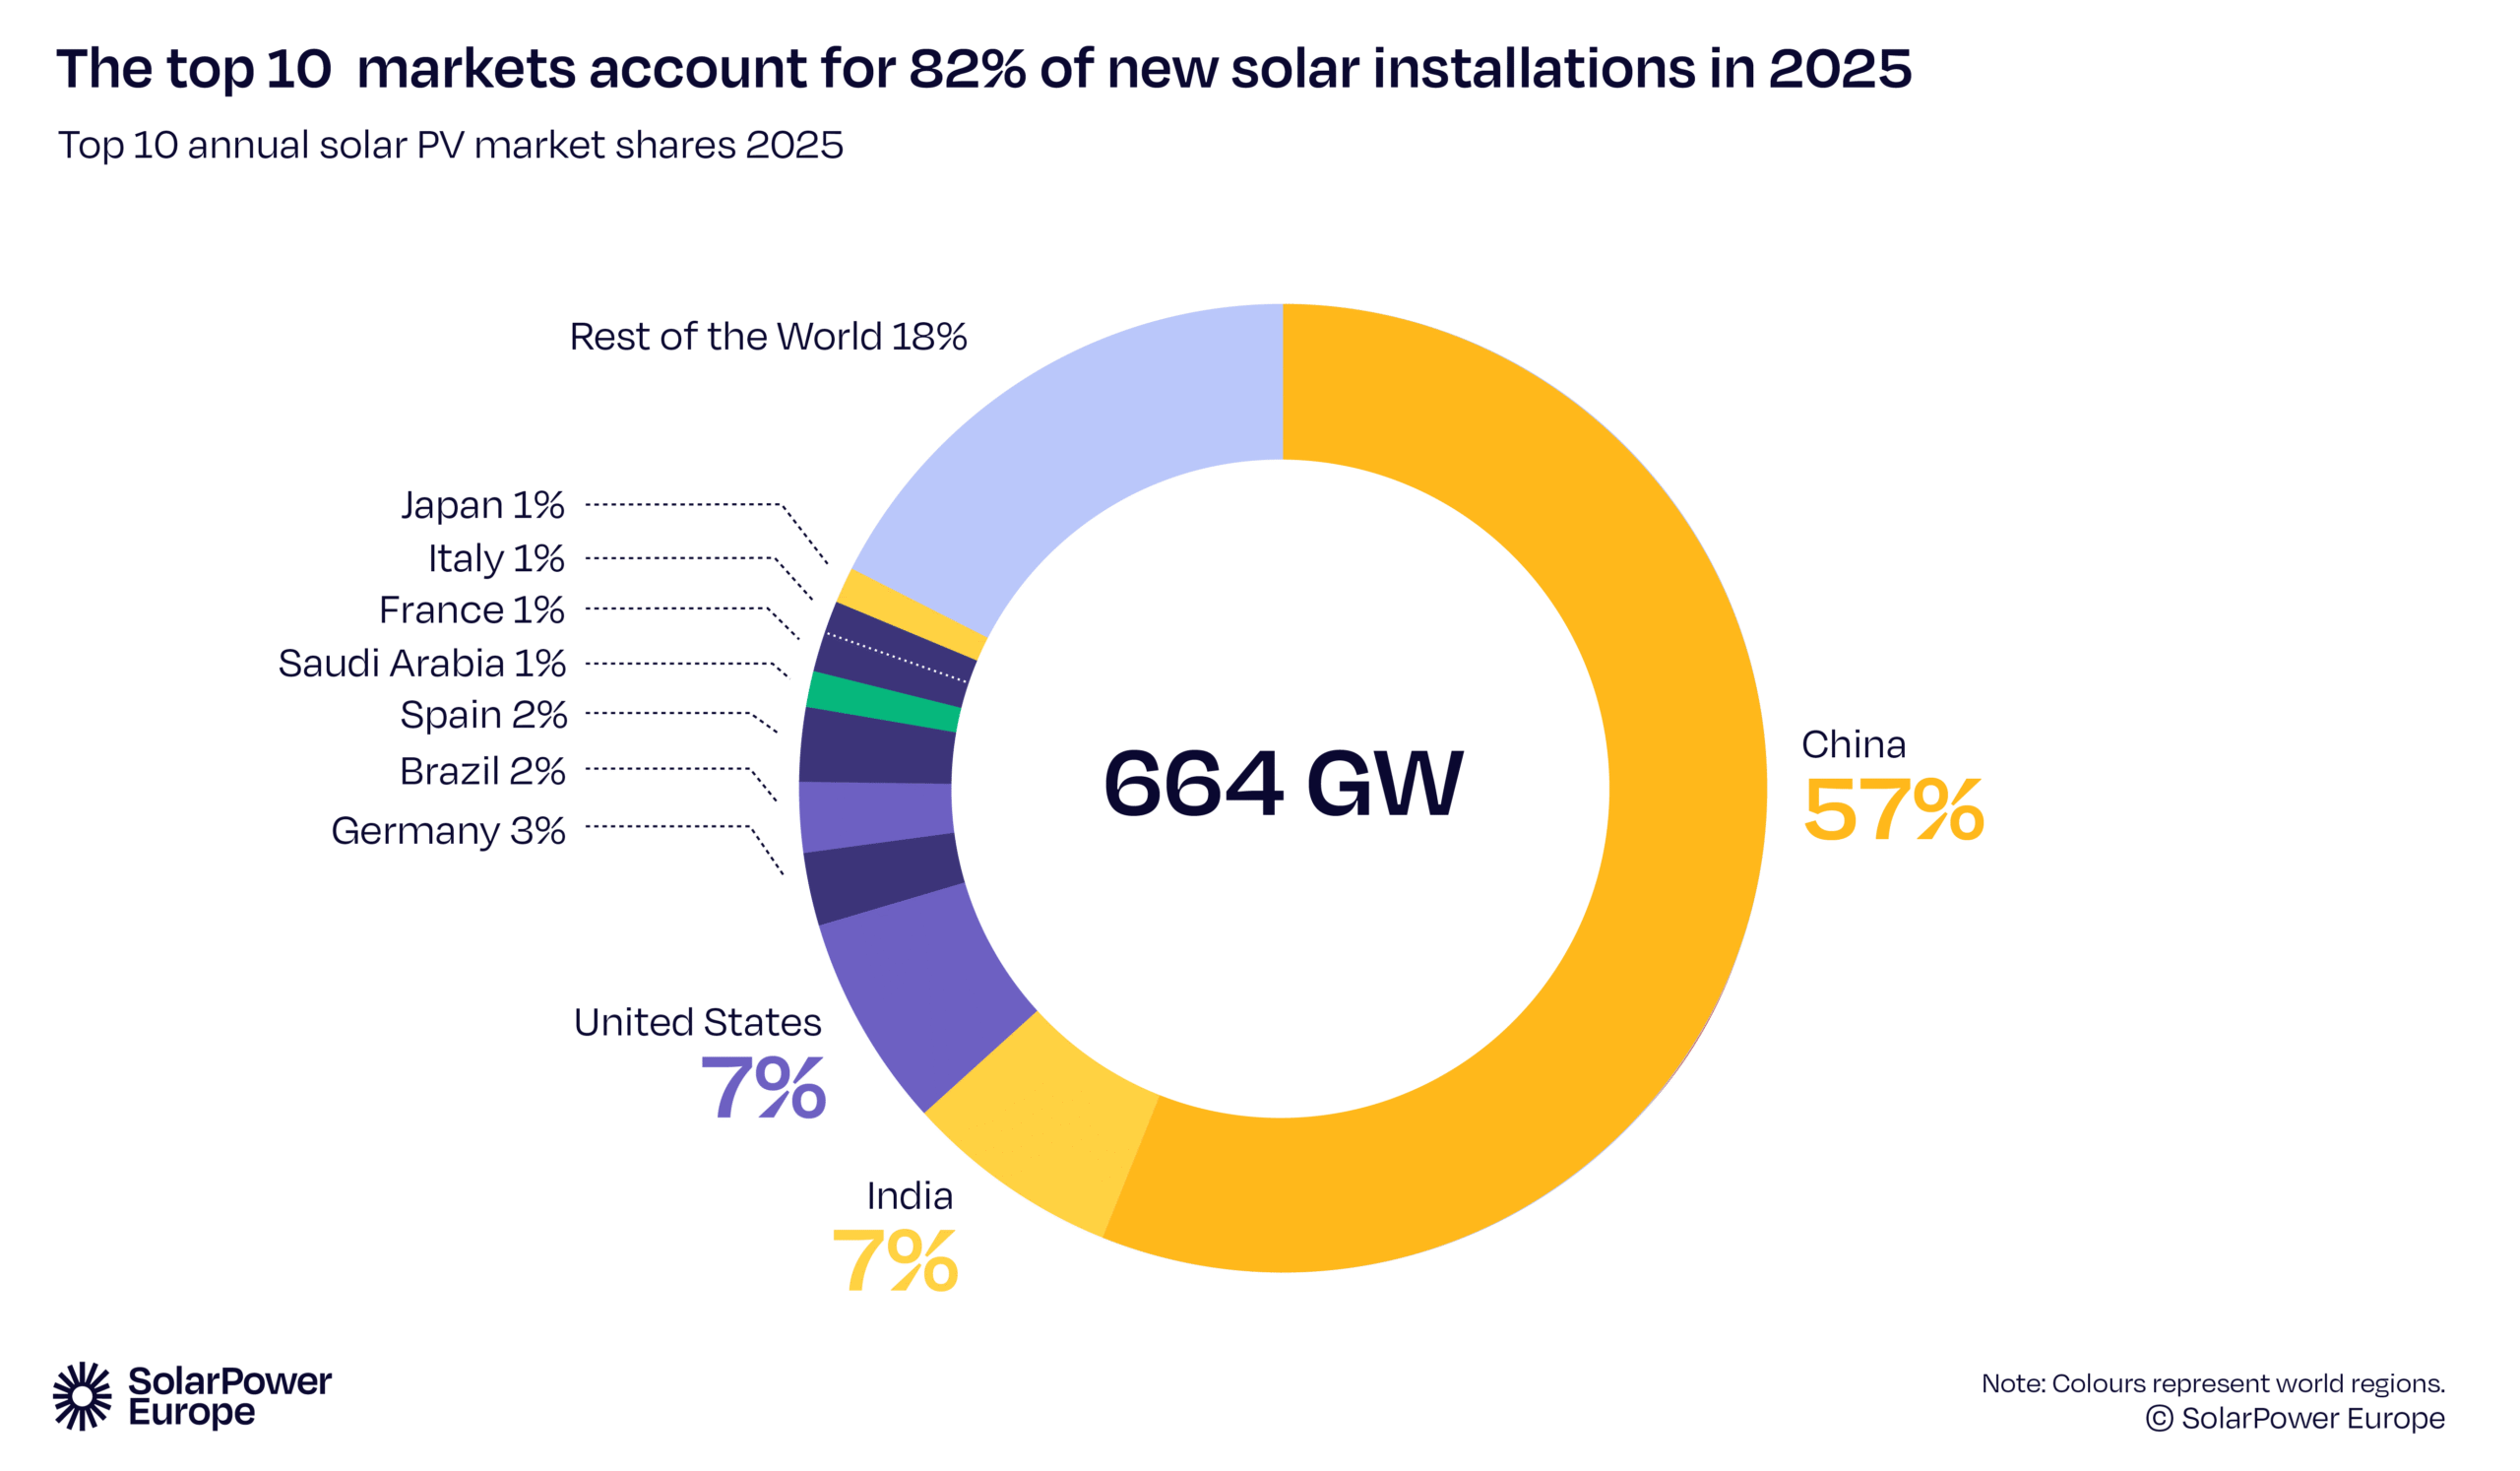
After several years of rapid expansion and a new all-time high of 664 GW in 2025, the global solar PV market is expected to decline in 2026, marking the first contraction in over 20 years. Under the most likely Medium Scenario, annual installations fall to 612 GW, representing an 8% contraction (see Fig 3). This turning point reflects increasingly diverging forces shaping the global solar market.
On the one hand, a projected 24% decline in China’s solar market is expected to weigh heavily on global volumes. At the same time, growing curtailment rates and more frequent episodes of negative electricity prices in mature markets are slowing deployment. These system constraints highlight the growing need for faster progress on grids, storage, and system flexibility.
On the other hand, the fundamental drivers of solar energy remain firmly intact. Solar PV continues to be one of the most cost-competitive and fastest-to-deploy energy technologies. Moreover, the current geopolitical environment and tensions in the Middle East are increasing uncertainty around fossil fuel supply and prices. In this context, solar PV is further strengthening its role as a strategic asset for governments, supporting both energy security and climate objectives. These opposing dynamics are reflected in the scenario range for 2026. The Low Scenario assumes a combination of a sharper decline in China and a broader slowdown in mature markets, bringing global installations down to 501 GW, a 25% contraction.
By contrast, the High Scenario points to continued, albeit slower, growth of 9% to 724 GW, driven by stronger deployment outside China. This pattern would echo the acceleration observed during the 2022 energy crisis. Despite this short-term divergence, all scenarios confirm that 2026 represents a temporary adjustment rather than a structural decline. Growth is expected to resume from 2027 onwards, reaching an annual market of 864 GW in 2030 under our Medium Scenario, representing a 7% compound annual growth rate over the next five years.
FIGURE 3
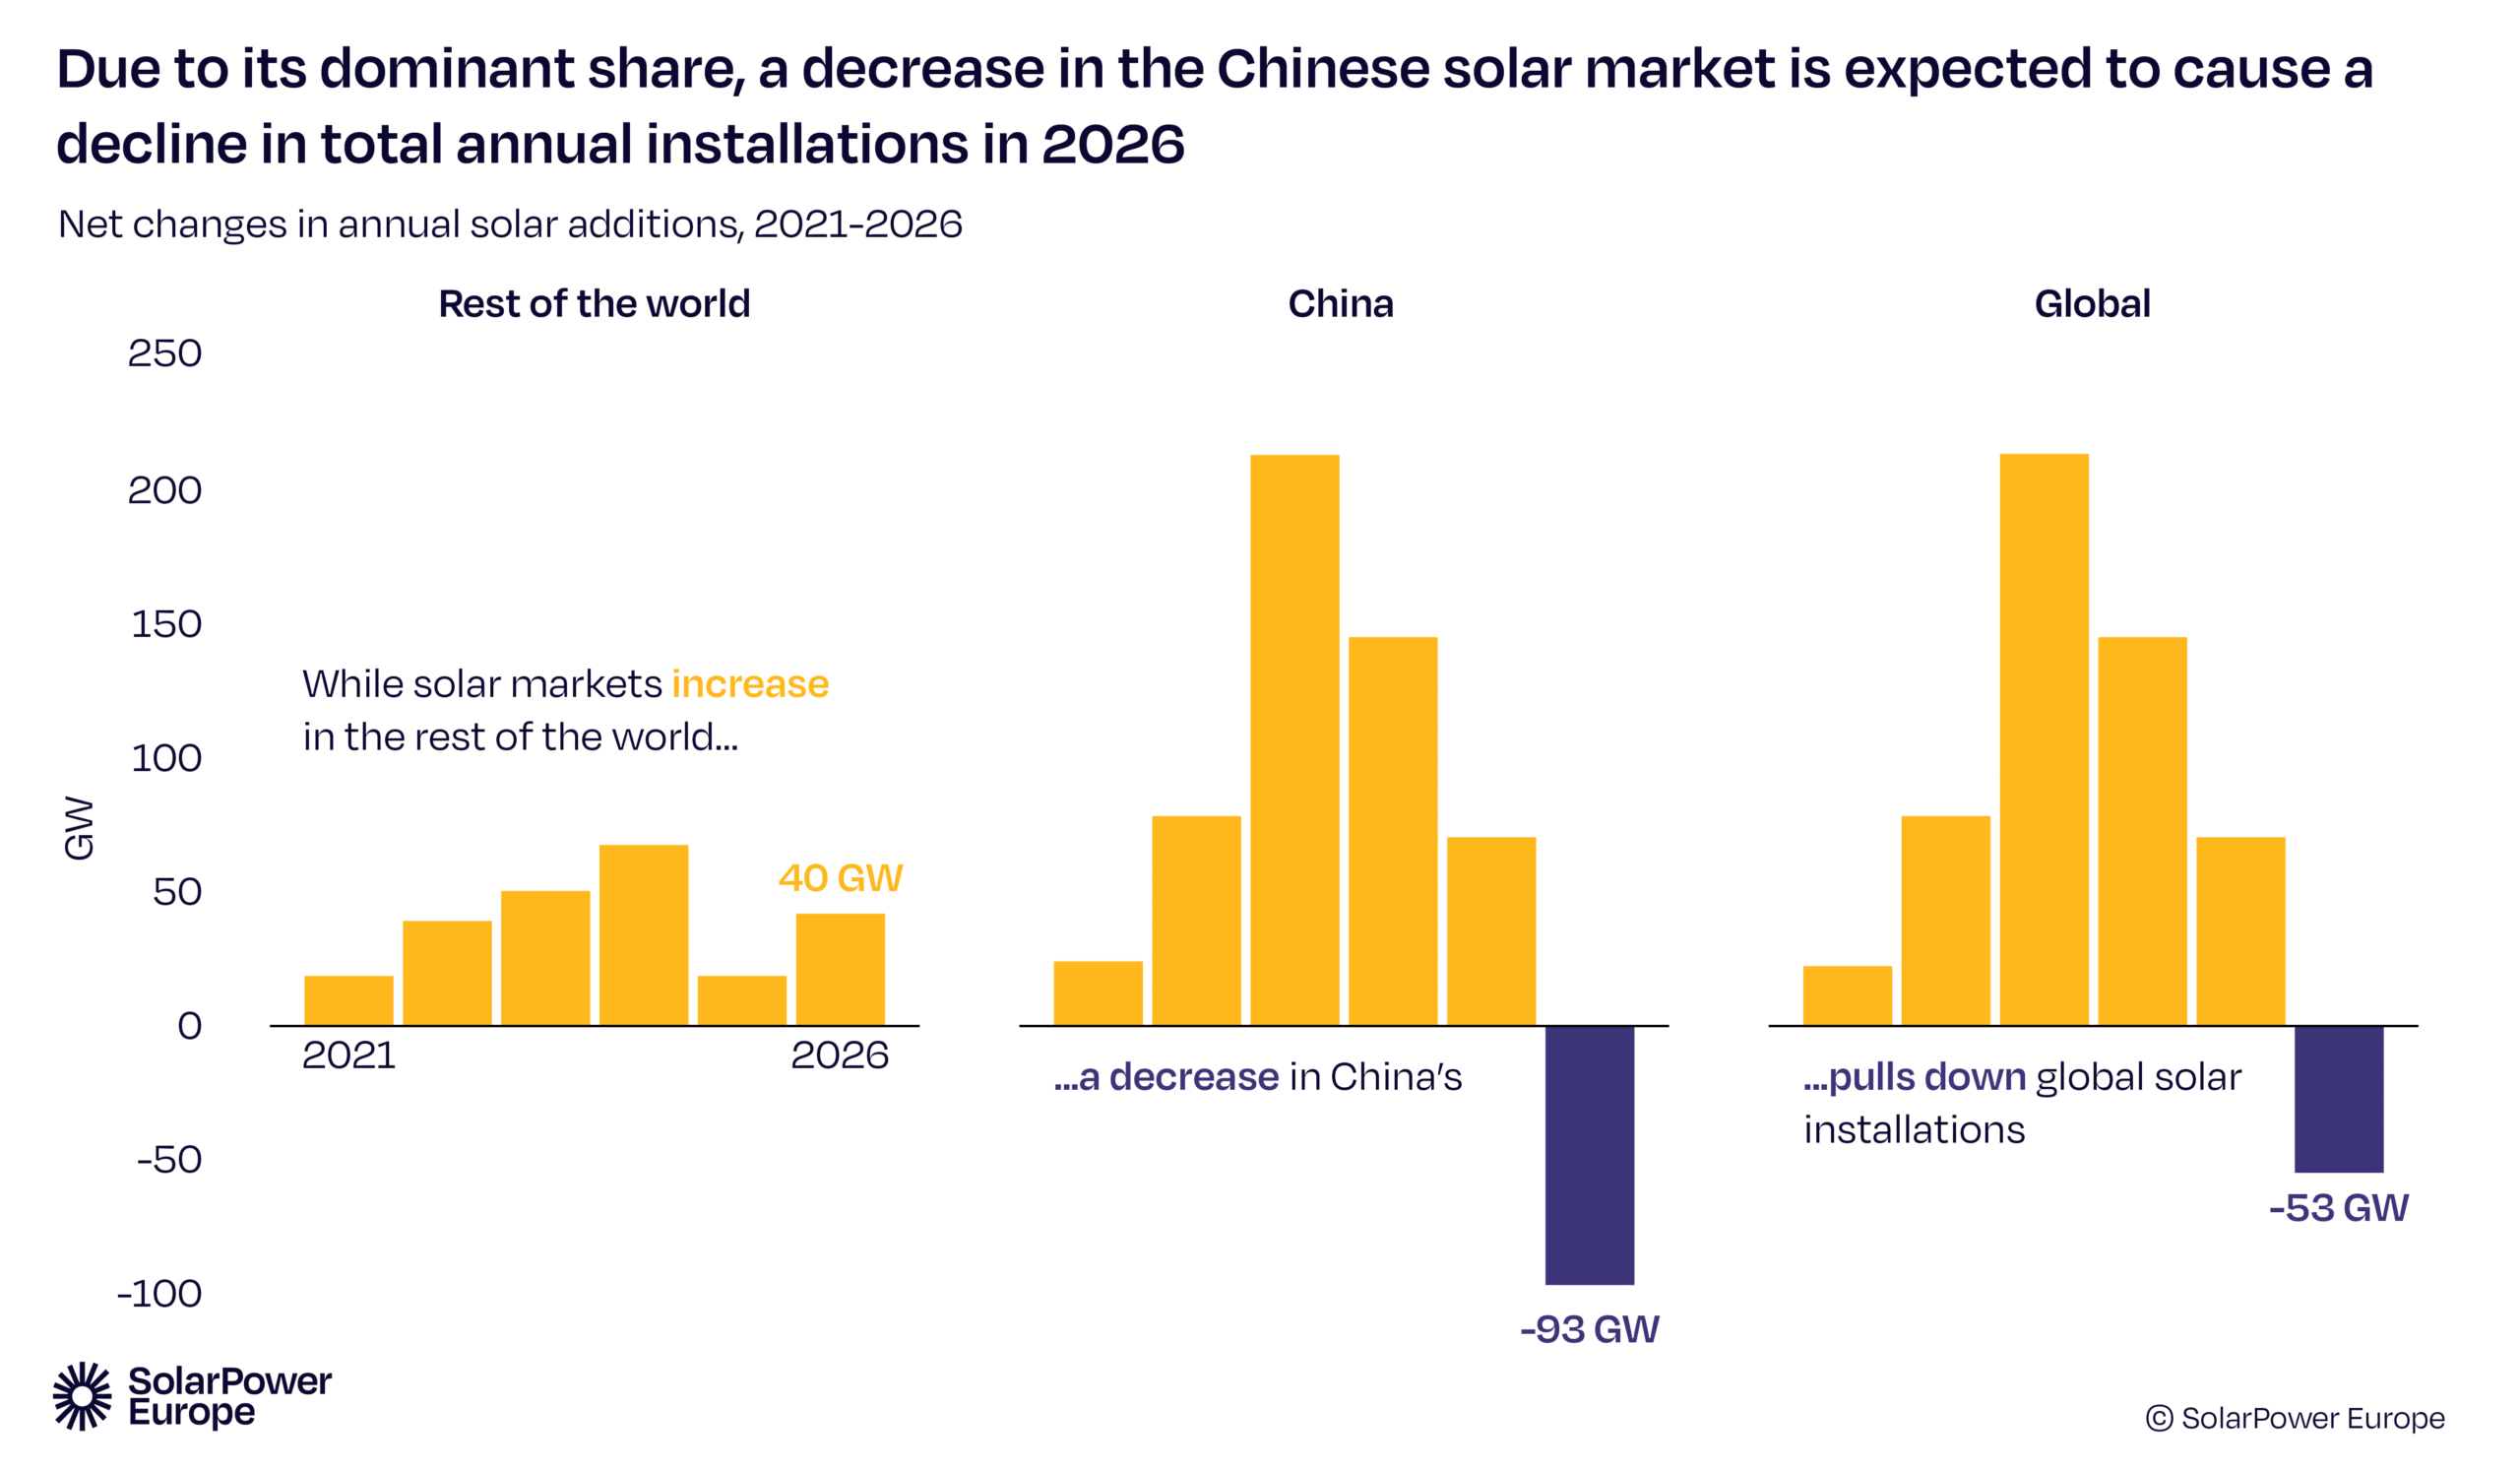
The global solar market compression in 2026 is largely driven by a 24% drop in China, which cannot be compensated through the growth expected in other regions
The expected decline in the global solar market in 2026 is first and foremost a China-driven story. Under our Medium Scenario, Chinese annual solar installations in 2026 are expected to be 93 GW lower than in 2025, dragging down global installations by around 53 GW. The decrease in China will more than offset continued growth of about 40 GW across the rest of the world. This imbalance highlights the scale of China’s solar market and its decisive influence on global trends (see Fig 4).
Both the exceptional growth in 2025 and the expected decline in the Chinese market in 2026 are driven by policy changes. Starting from 1 June 2025, the previous fixed feed-in tariff regime was discontinued, and new projects must sell electricity on the power market instead of receiving a guaranteed tariffs payment. As a result, developers front-loaded installations ahead of this date to benefit from the last feed-in tariffs. Following this, monthly installations sharply decreased in the second half of 2025 and, so far, also in 2026.
In contrast, solar deployment outside China continues to expand across all regions in 2026, supported by solid underlying fundamentals. Asia-Pacific excluding China is expected to increase by 18%, driven by India and several emerging markets. Europe is projected to grow modestly by around 3%, reflecting increasing market maturity, while the Americas are expected to expand by 11%. The Middle East and Africa region leads in relative terms, with installations forecast to surge by 48% from a low base. Due to the contraction in China, all other regions are set to gain global solar market share in 2026.
This divergence between a contracting Chinese market and a growing rest of the world underlines a key message for 2026: the global decline should not be mistaken for a structural slowdown. Instead, it reflects the weight of China as a single dominant market, whose variations are inevitably reflected in global installations.
FIGURE 4
Cumulative capacity surpassed 3 TW in early 2026, and is expected to reach 6.6 TW by 2030
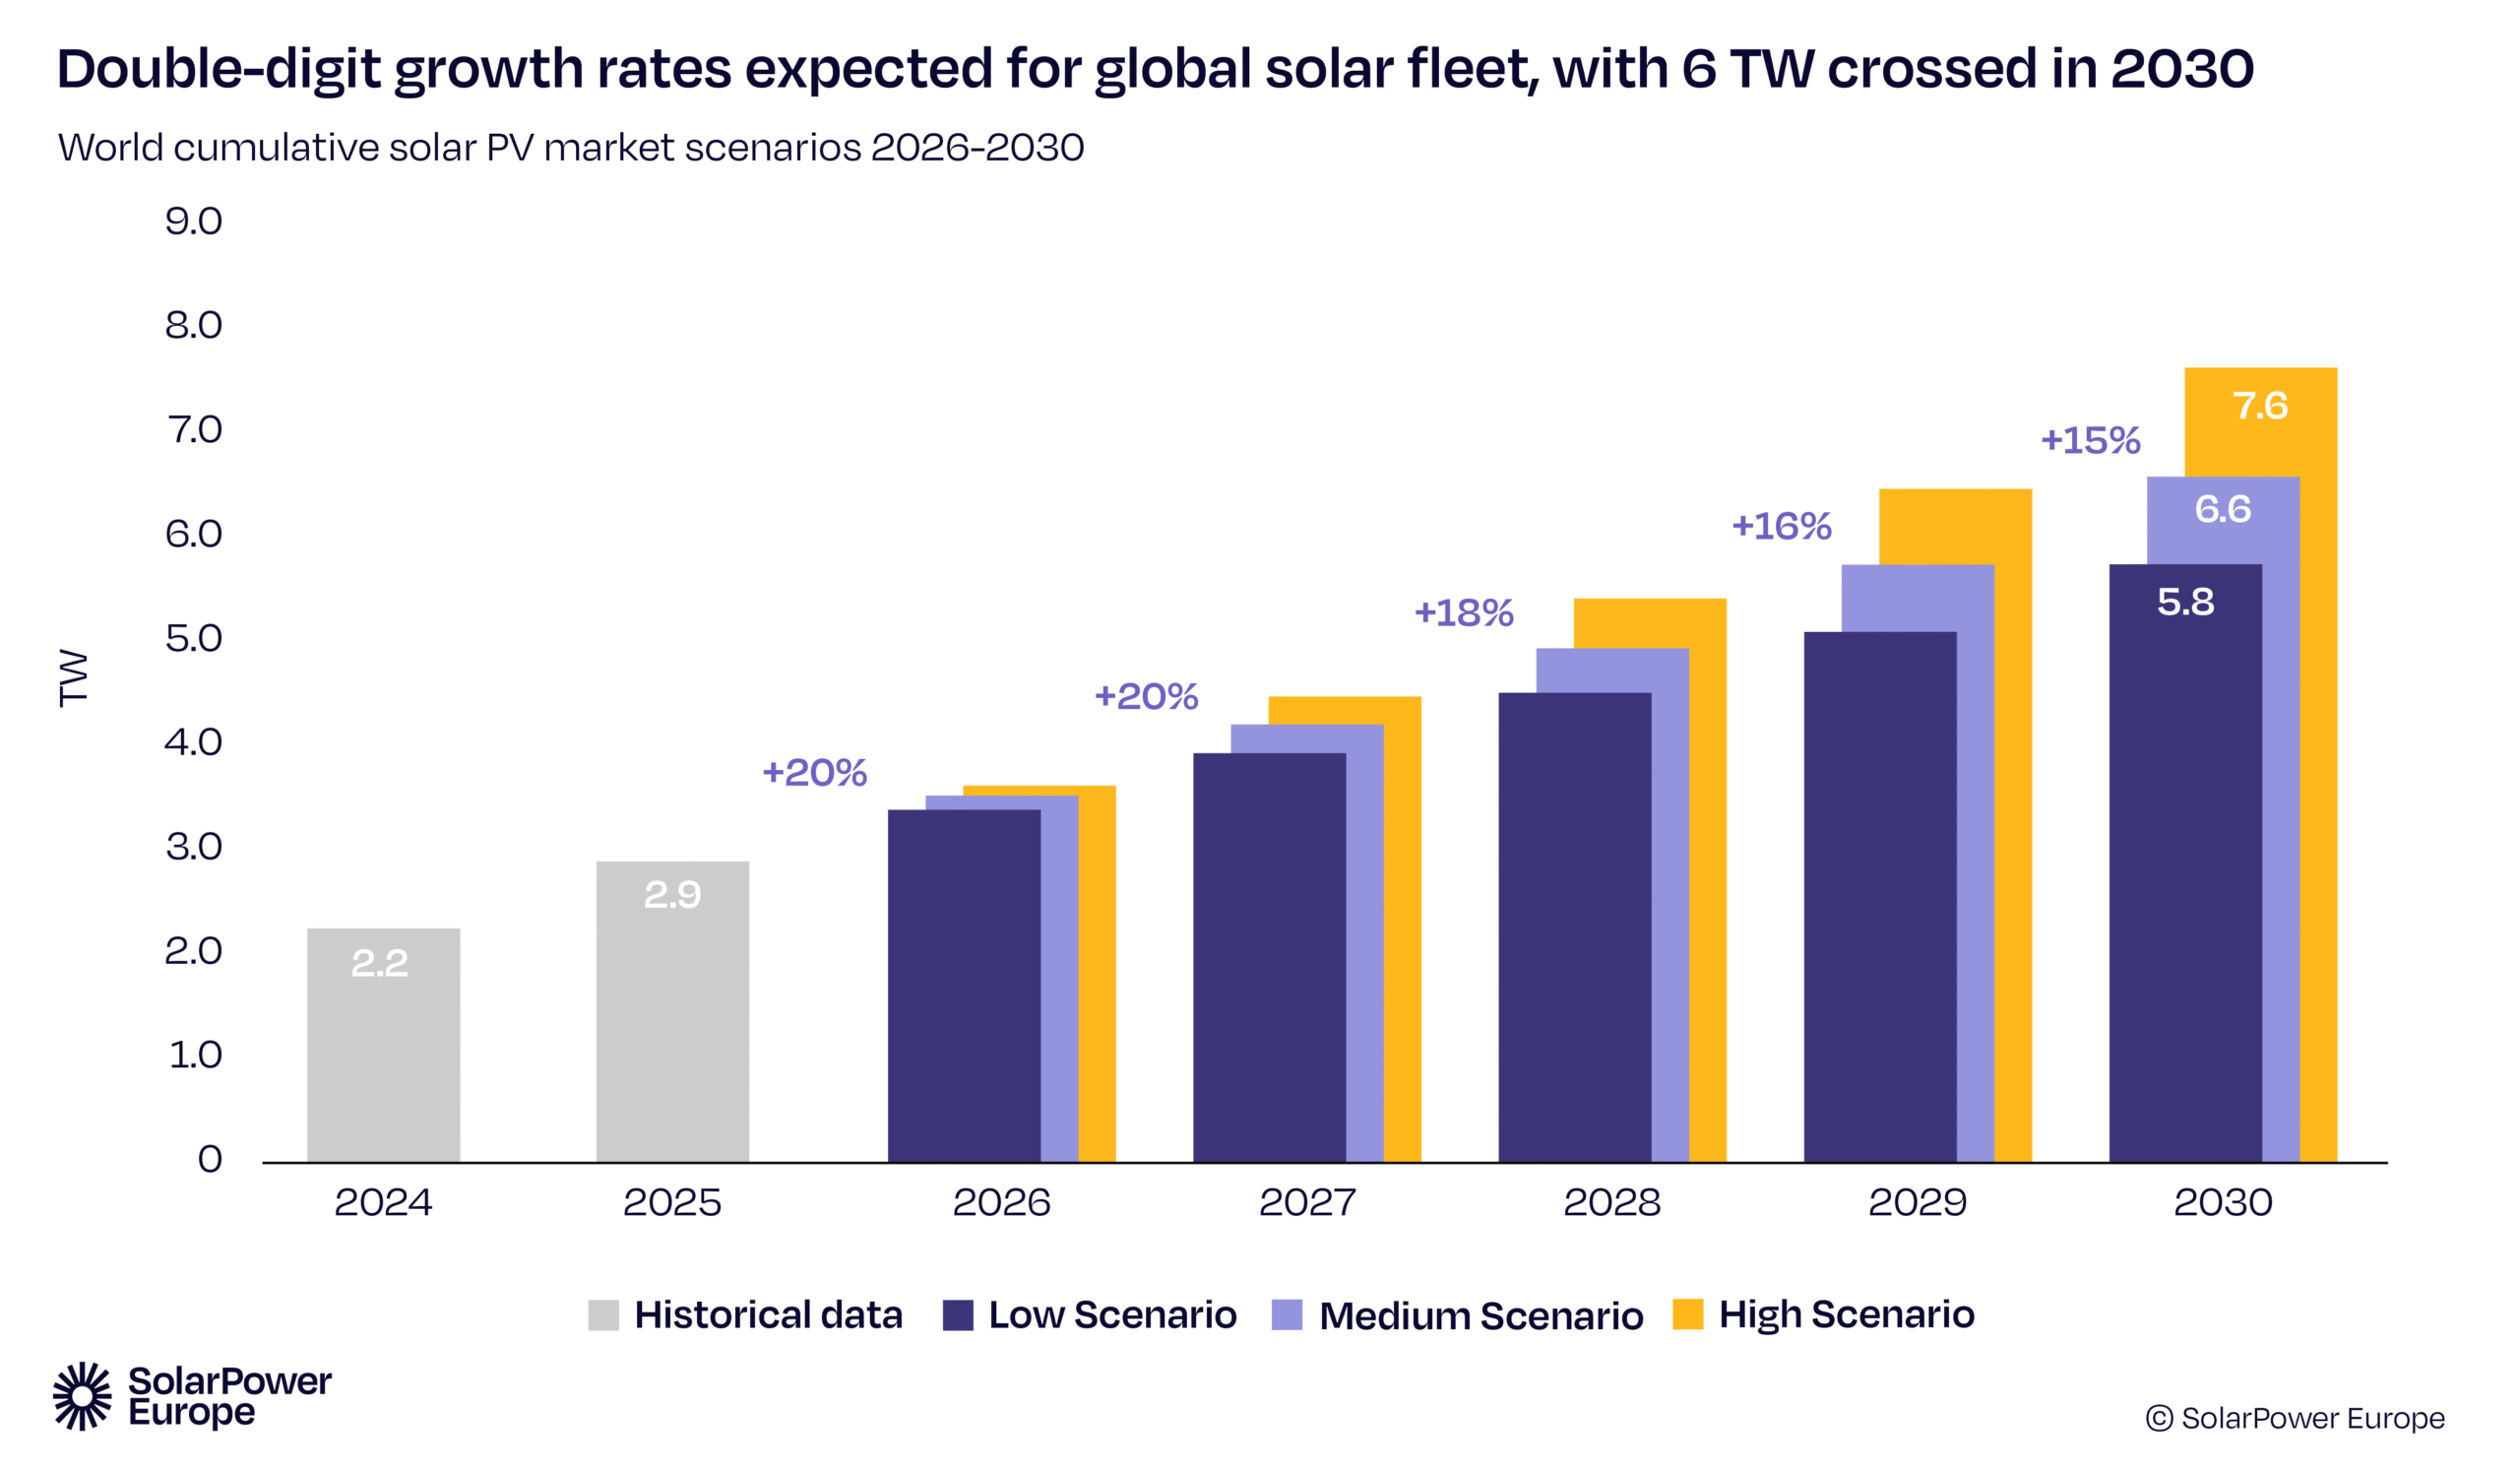
After crossing the 2 TW threshold in 2024 and reaching around 2.9 TW in 2025, global capacity surpassed 3 TW in early 2026, confirming the unprecedented speed of solar deployment in recent years. It took nearly seven decades to install the first terawatt of solar capacity, yet less than four years to triple it.
Looking ahead, the global solar fleet is projected to more than double again, reaching 6.6 TW by 2030 under the Medium Scenario. While this outlook implies strong growth rates, it represents a downward revision compared to last year’s forecast of 7.1 TW, reflecting increasing system constraints and a more cautious near-term trajectory. In the context of the COP28 pledge to triple renewable energy capacity to 11 TW by 2030, solar PV is expected to play the central role: under current market developments, solar alone would deliver around 60% of this target, underlining its unmatched scalability, cost-competitiveness, and speed of deployment.
Overall, while short-term uncertainties persist, the long-term outlook for solar remains strong, with the technology continuing to expand at an unprecedented pace and cementing its role at the core of global decarbonisation efforts, and its new role as the key technology for countries striving for more energy security.
FIGURE 5
Download the full ‘Global Solar Market Outlook 2026-2030’ here
This is the end of the introduction to this executive summary report, so please take a look at the more detailed data and analysis in the main body of the report.
Link: https://www.solarpowereurope.org/insights/outlooks/global-solar-market-outlook-2026-2030
This report comprises a total of 174 pages, with information on the Japanese market (provided by JPEA) included on pages 132–135. We also feature articles regarding the Japanese market.
Acknowledgements: We would like to express our gratitude to SolarPower Europe and all the related parties for publishing comprehensive reports on trends in the photovoltaic market every year.