PV column
Photovoltaic
2023/09/21
“Global Market Outlook For Solar Power 2023-2027” by SolarPower Europe
To learn more about the global solar market and its trends over the next five years, SolarPower Europe has published this year’s edition of “Global Market Outlook for Solar Power 2022-2026.” The market trend of solar power generation is very clearly summarized.
Source: https://www.solarpowereurope.org/insights/outlooks/global-market-outlook-for-solar-power-2023-2027#download
This column provides an introduction and executive summary of this report. The graphs in the main articles of the report are attached as a reference to this column.
***********
Foreword
Welcome to the Global Market Outlook for Solar Power 2023-2027.
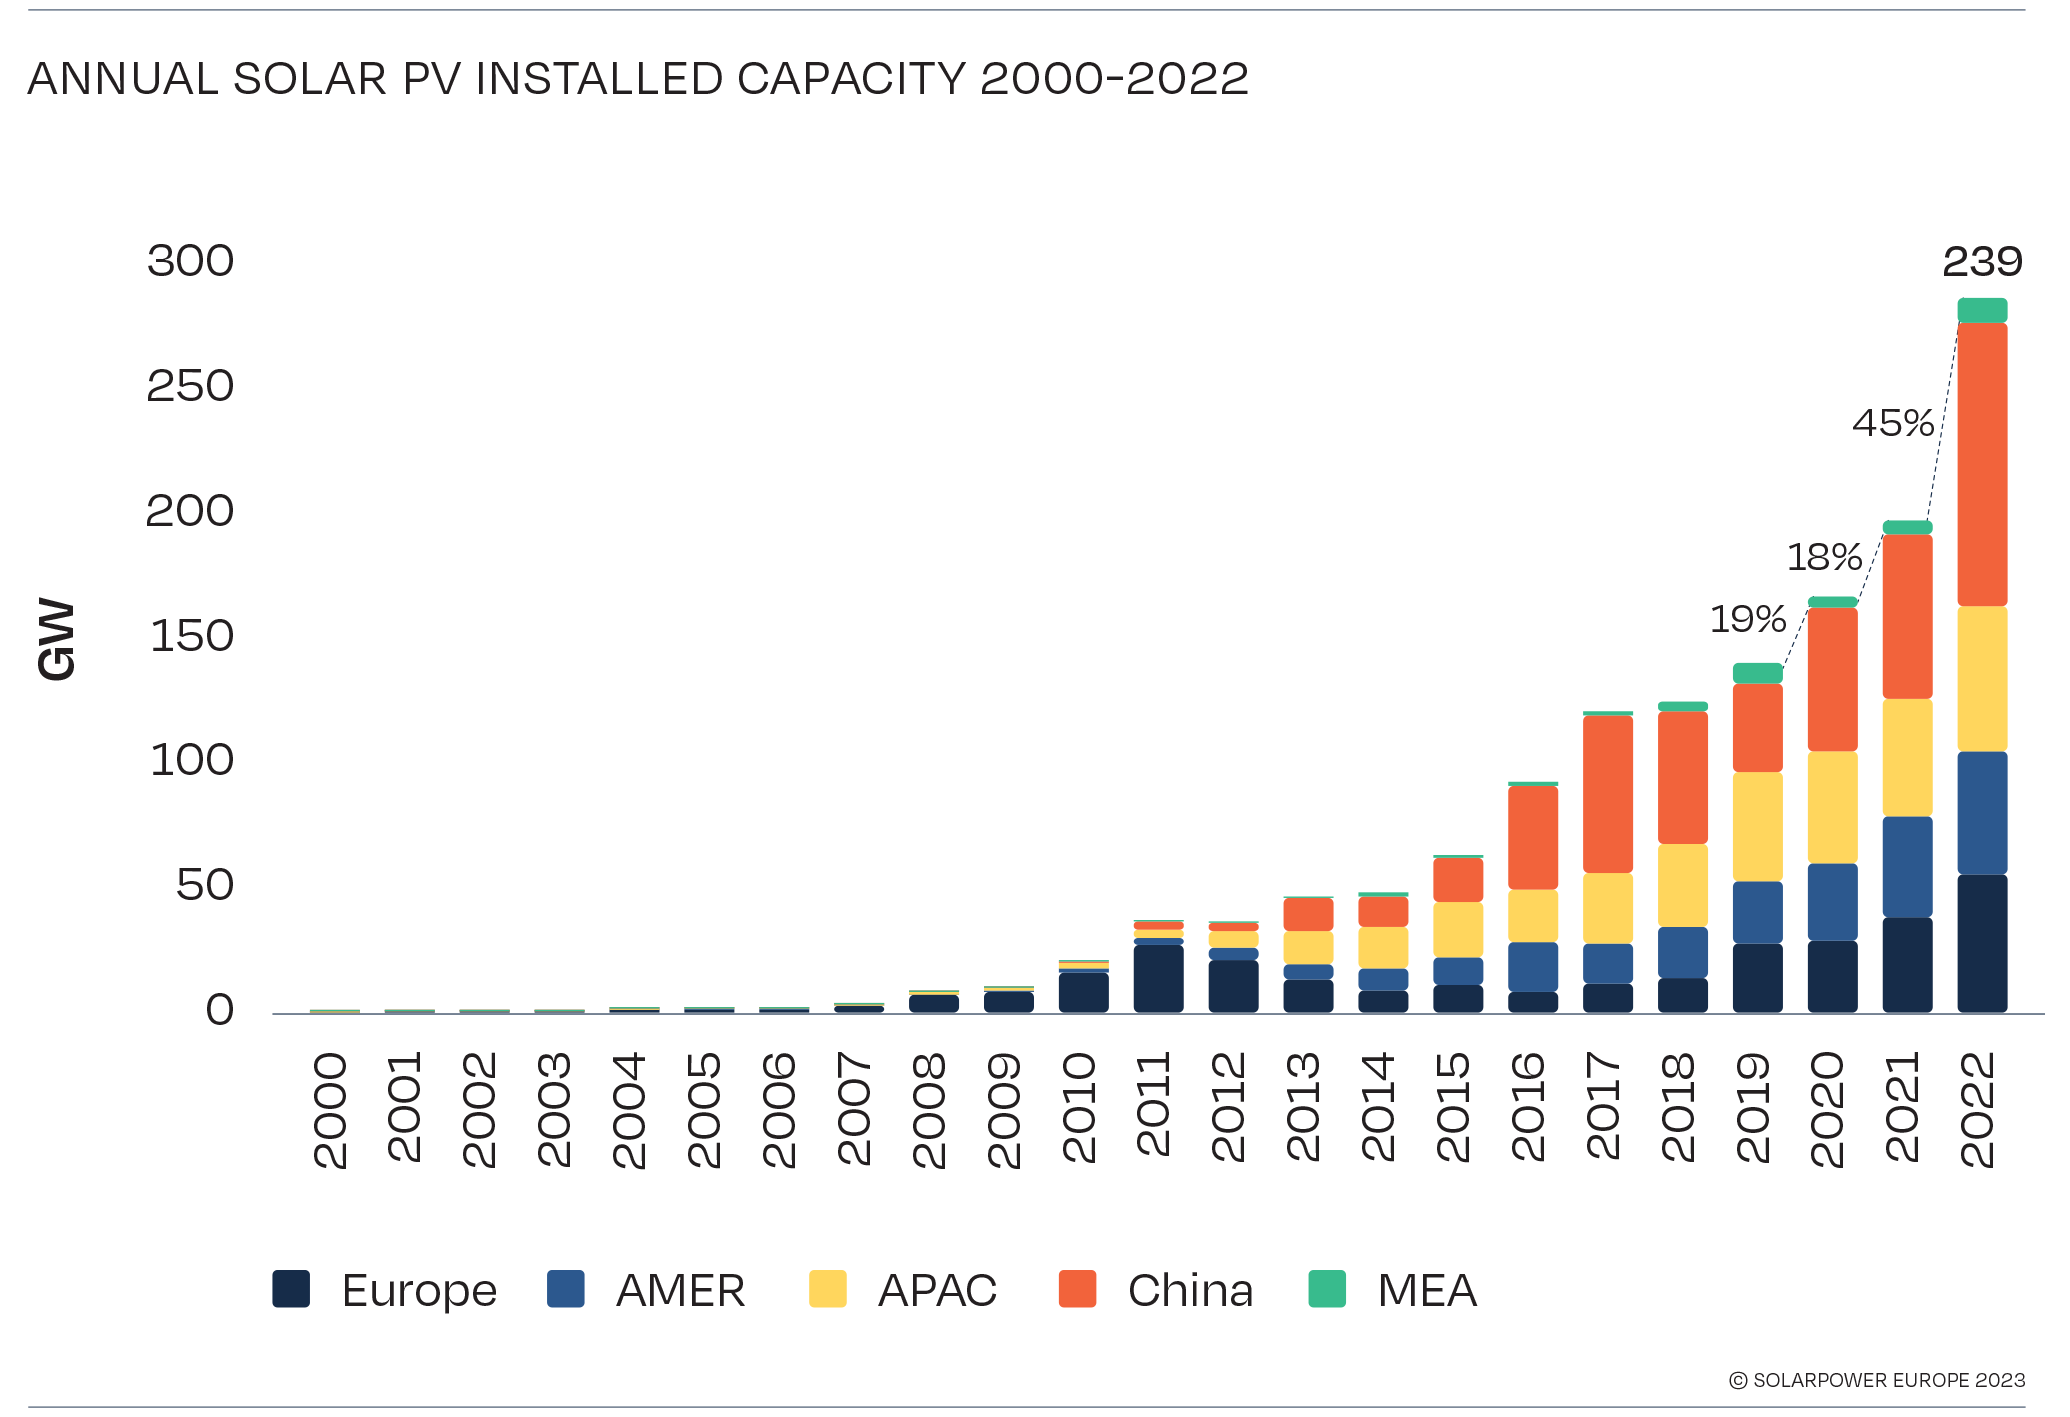
Solar is on the fast track. In 2022, the world installed 239 GW of new solar, finally surpassing the TW-scale. That’s 45% more solar power capacity than the year before. The positive market developments in the first months of 2023 promise another solar boom year, expected to result in 341 GW of newly-added solar to the grid, by the end of the year – equal to 43% growth.
Graph 1. Net renewable power generation capacity installed in 2022
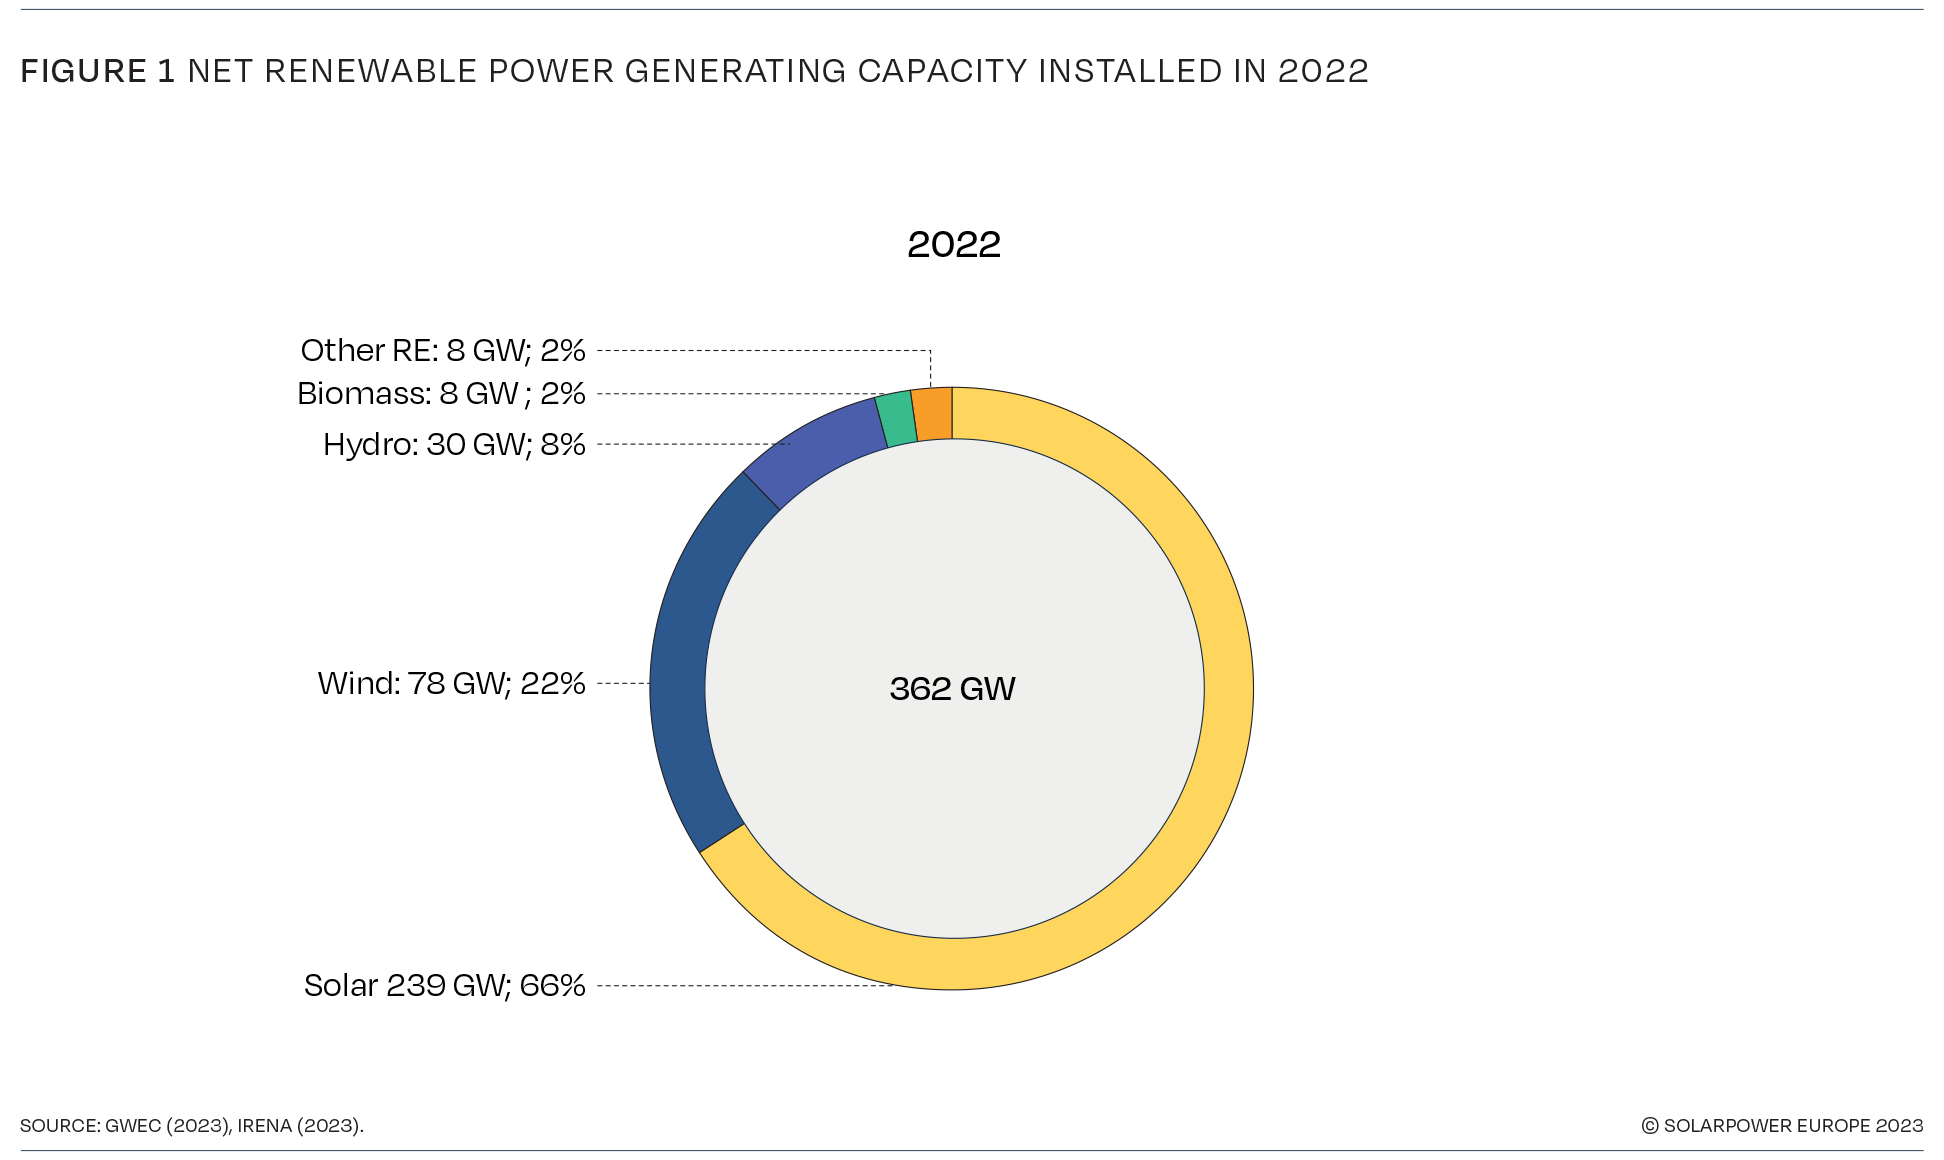
This solar rush comes after more modest progress in preceding years, which were characterized by pandemic triggered lockdowns, supply chain turbulence, and high product prices along the value chain. However, even in trickier times, the solar industry demonstrated very strong resilience, with newly installed lobal capacities increasing by 19% in 2020 and 18% in 2021.
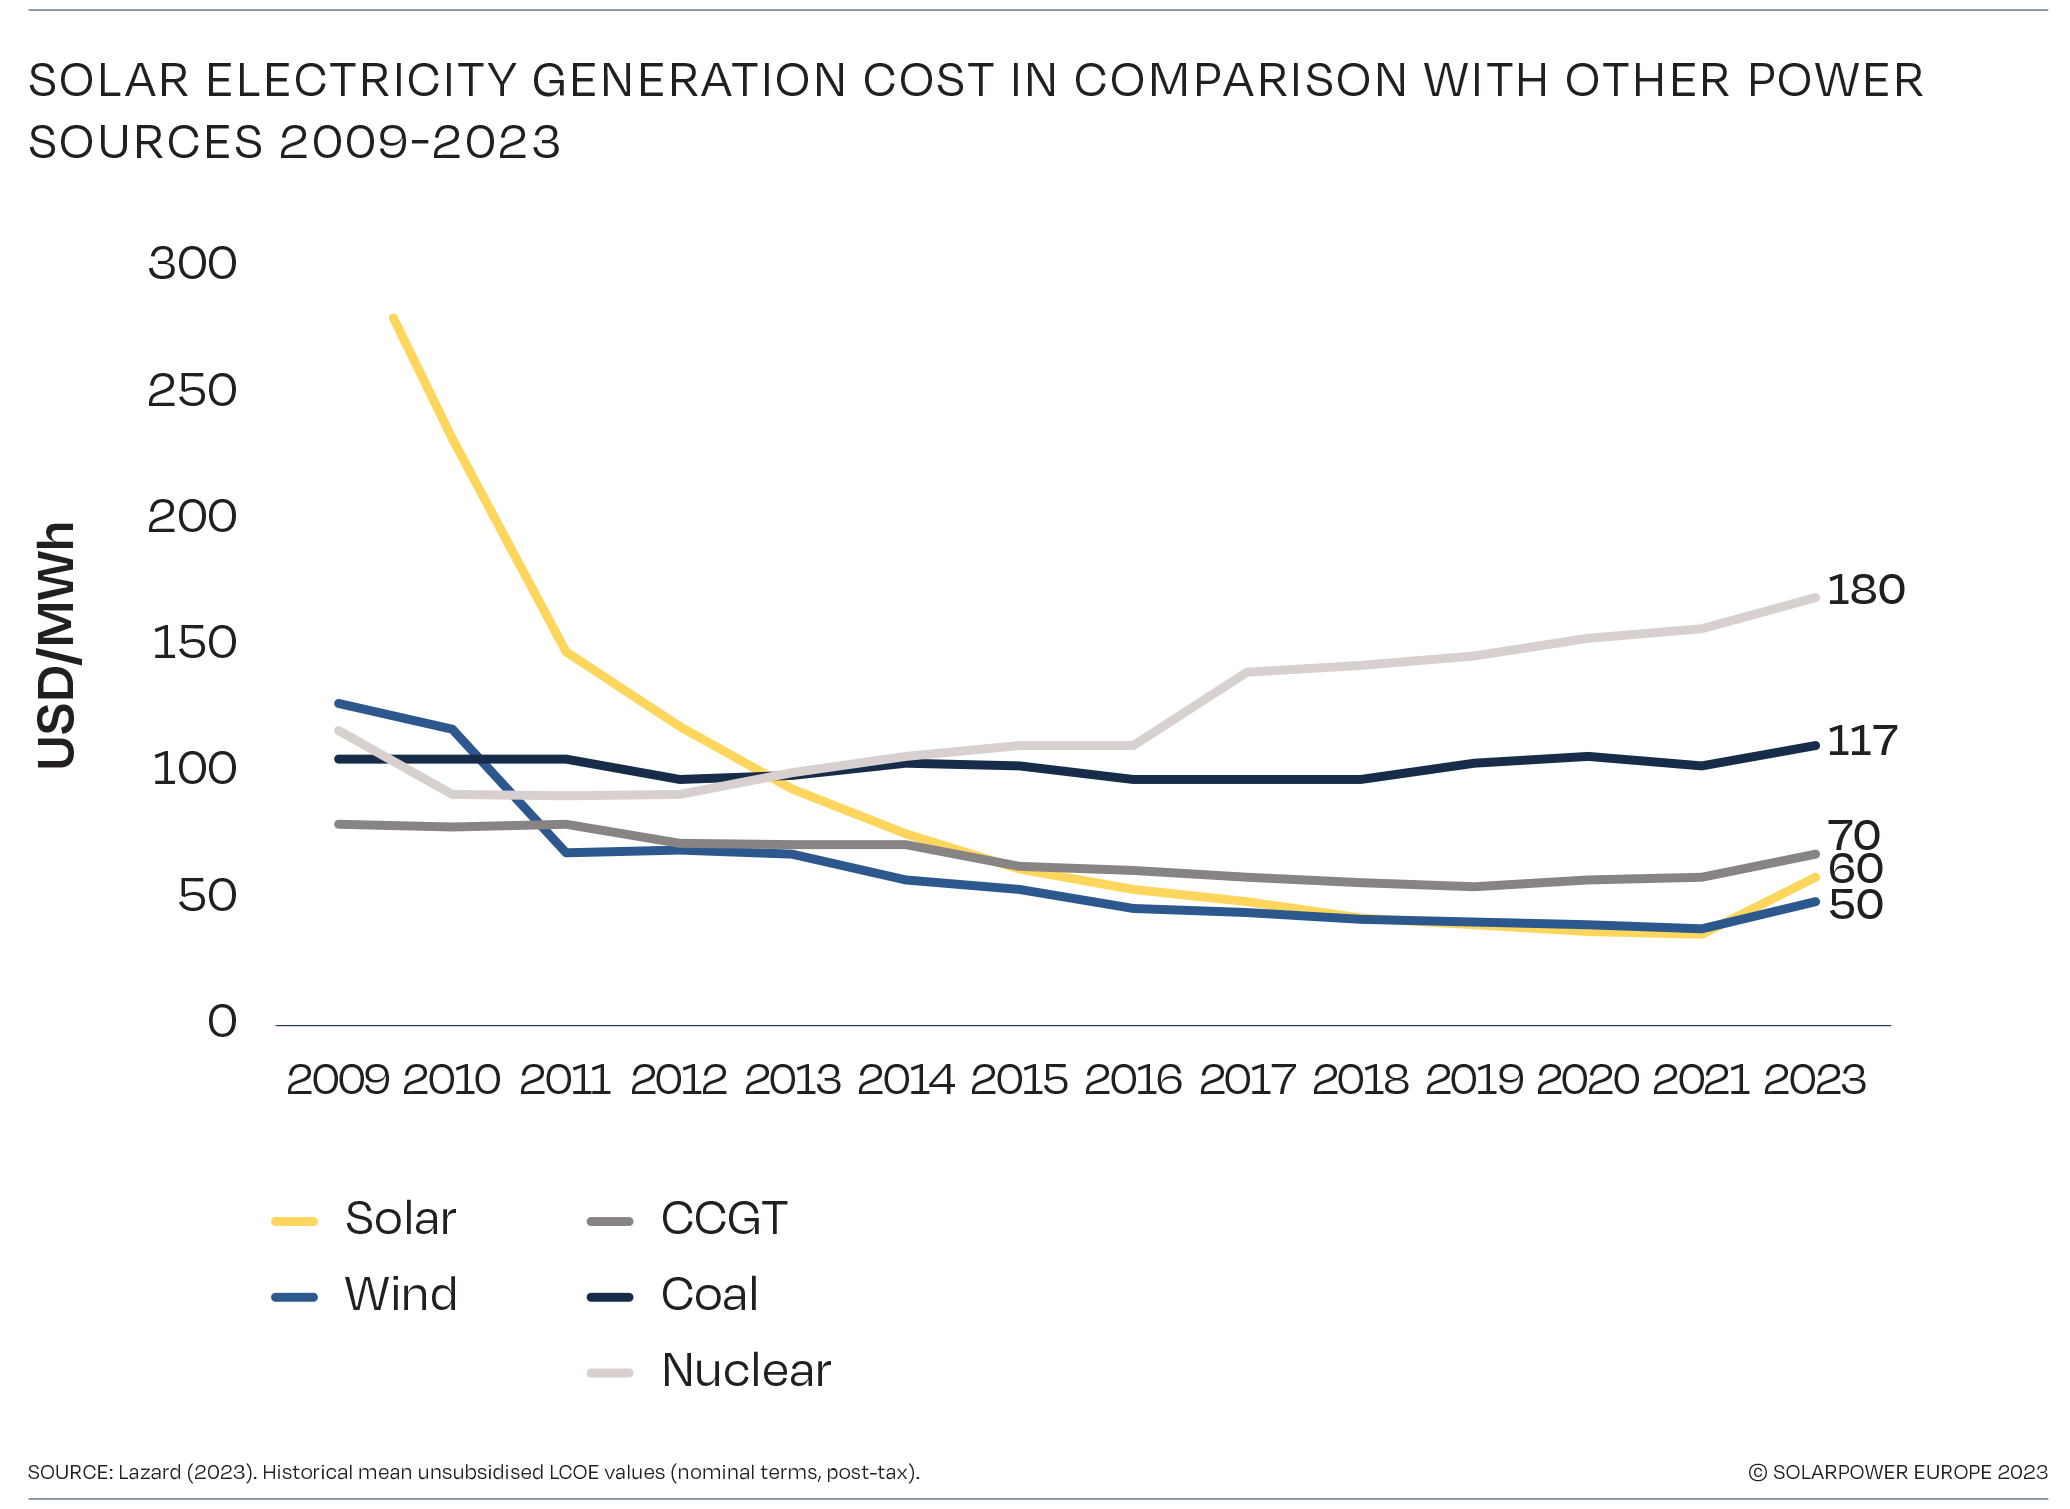
The reasons for this spectacular performance are obvious. It comes down to the unmatched versatility of solar – powering individual energy self-sufficiency and comparatively quick-deploying utility-scale projects at competitive low cost. Despite solar’s levelised cost of electricity (LCOE) sliding upwards – for the first time – due to supply chain issues and inflation, it remains profoundly cheaper to produce electricity from solar than from new fossil fuel and nuclear power sources.
Graph 2. Solar electricity generation cost in comparison with other power sources 2009-2023
What changed for solar power in 2022 – and why we consider the year an inflection point – is the technology’s newly discovered image by a growing number of policymakers. Solar power now enjoys widespread acceptance as the key tool to achieve local energy security in the midterm. During the recent fossil fuel sparked energy crisis, the International Energy Agency (IEA) used two reports to highlight solar’s critical role to reduce the European Union’s dependence on Russian gas.
The EU Solar Strategy of May 2022 even called solar the ‘kingpin’ of the continent’s effort to get off Russian gas. Such geostrategic considerations are applicable for other energy importing countries as well. In other words, solar has now untangled what was previously considered a gordian knot – the so-called energy trilemma of sustainability, affordability, and security of supply.
The annual Global Market Outlook for Solar Power is a project that comes to life with the support and in-depth knowledge of the world’s major regional and local solar industry associations. These organisations are working hard to improve the policy frameworks that are essential for solar power to thrive around the world. From these organisations, this report contains in-depth features on the 26 countries that added at least 1 GW of solar in 2022. There are nine more GW-scale solar markets in 2022, compared to the 17 in 2021. The number of the world’s serious solar markets will more than double to over 50 by 2025. This edition has both a regional and a topical focus – this time on Southeast Asia and PPAs in emerging markets. The idea was to highlight advances and challenges in countries that are often not on the global solar map. These features have been created in cooperation between SolarPower Europe, the Global Solar Council (GSC), through its member, the Asian Photovoltaic Industry Association (APVIA), and GET.invest.
With global supply chain issues largely overcome, and gigantic PV production capacities being built up, prices have dropped significantly across the value chain in recent months and are expected to dip below pre-pandemic levels soon. That will propel demand to the next level. In general, we are more confident than ever that solar will remain on the fast track in the years to come. How fast will depend on the regulatory environment needed to enable that growth – from simpler permitting and stronger grid capacities, to supported solar-storage hybrid solutions. Our 2023 High Scenario foresees 402 GW new solar this year and close to 800 GW in 2027. Having achieved over 1 TW of total solar capacity in 2022, we now see the potential for an annual TW-scale market by 2030.
**********
Executive summary
2022 will be remembered as the year when solar deployment, driven by soaring energy prices, supply chain stabilisation, and post-pandemic recovery programs, entered a new growth dimension. In 2022 the world connected 239 GW of new solar capacity to the grid, marking yet another all-time record and registering an impressive 45% annual growth rate, the highest since 2016. As a consequence, total global installed solar capacity crossed the Terawatt threshold in early 2022 and amounted to almost 1.2 TW by the end of the year, with a 25% increase compared to 2021 levels.
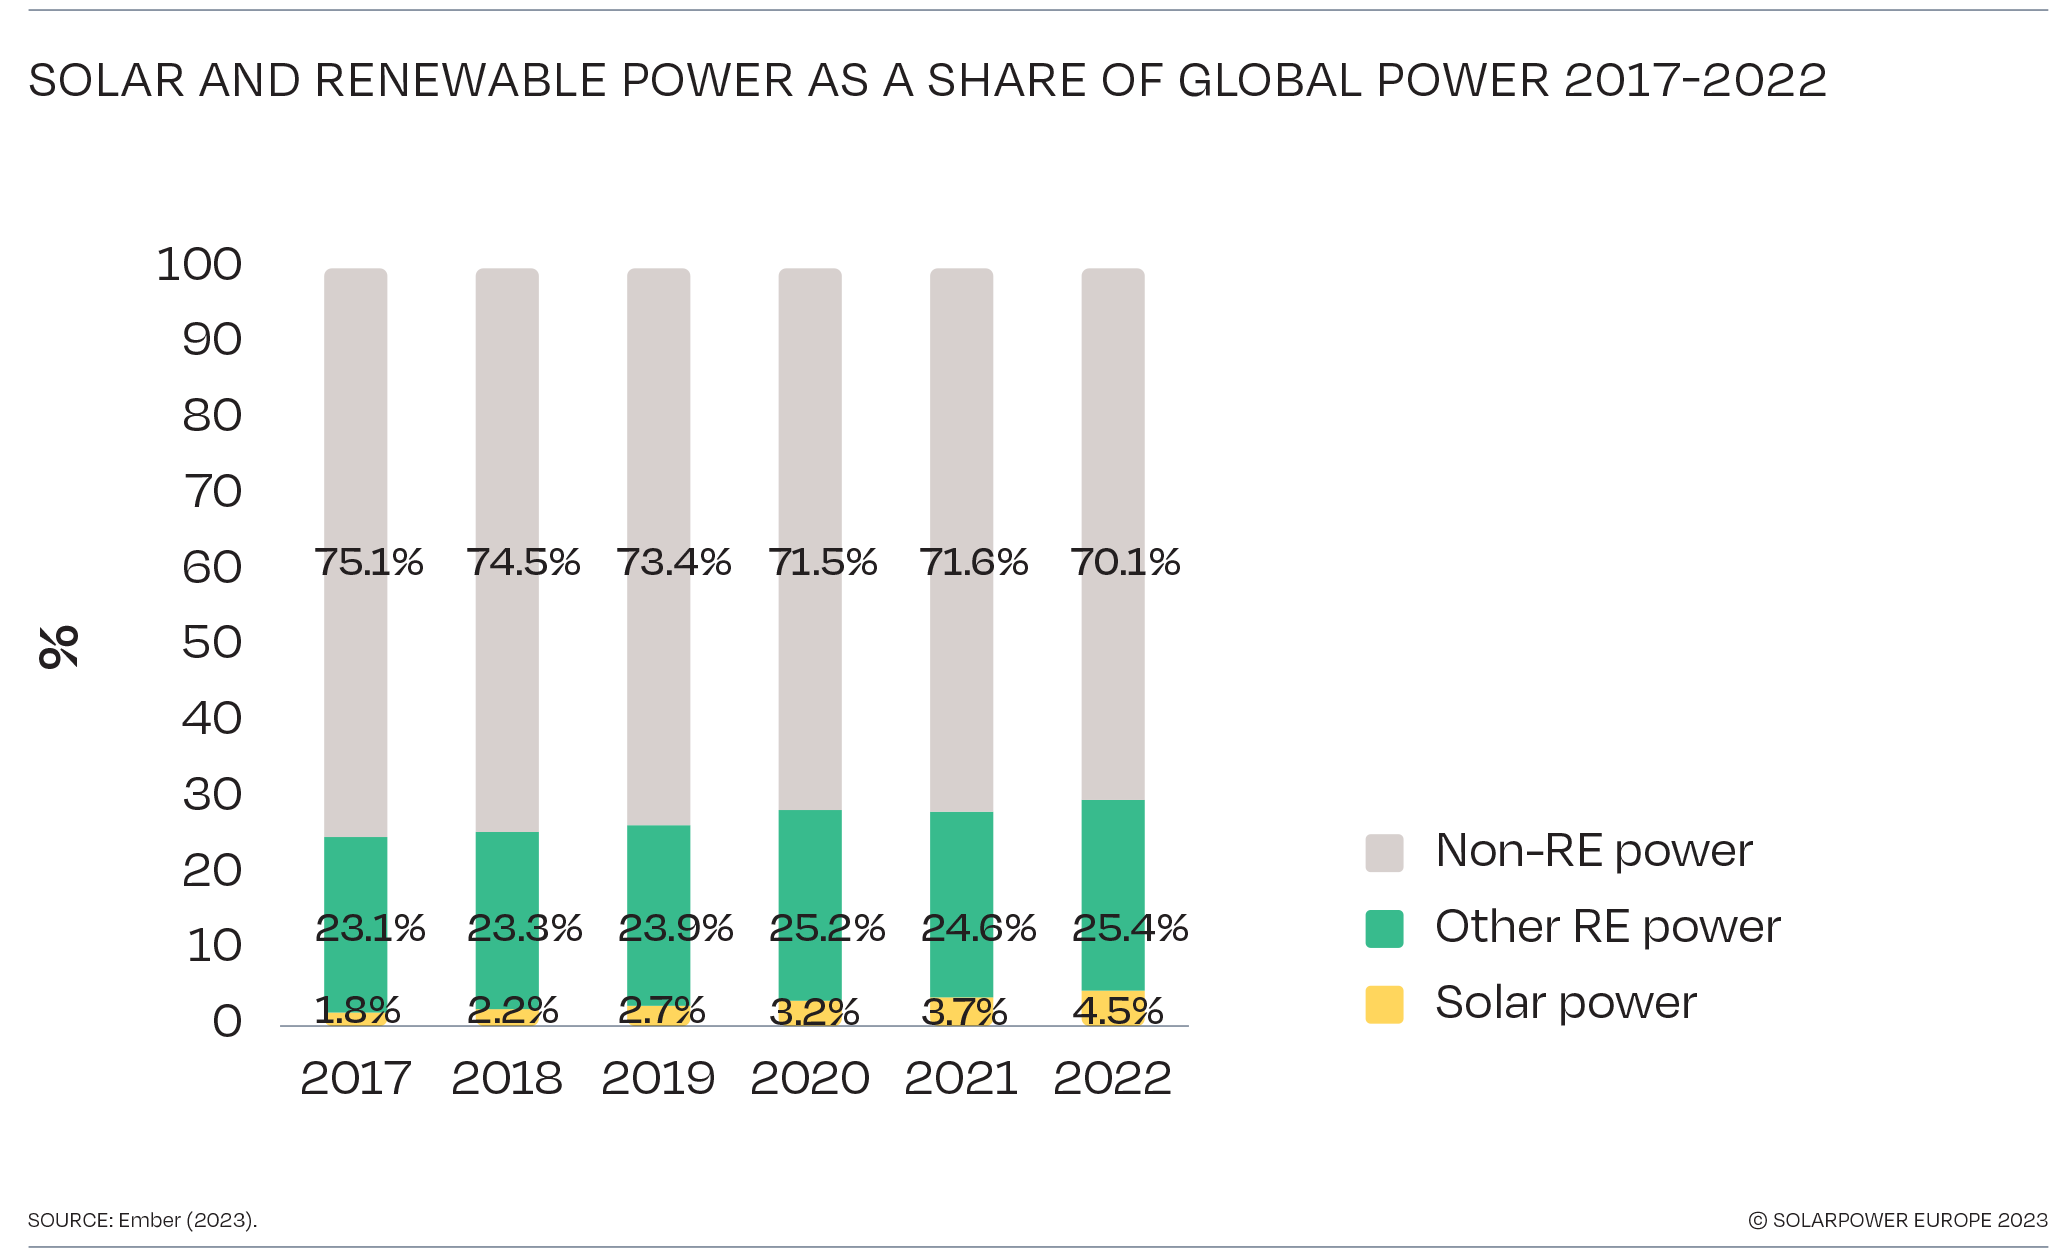
Solar’s expansion has no match across other power generation technologies. Solar PV claimed two-thirds of all new renewable power capacity installed last year, and the highest growth rate in terms of electricity generation across any power generation technology (24%). At the same time, however, solar still only meets 4.5% of global electricity demand, while over 70% is provided by non-renewable sources.
Graph 3. Solar and renewable power as a share of global power 2017-2022
In 2022, significant supply chain disturbances, lingering COVID-19 effects, and inflationary pressure, sparked by the war in Ukraine, caused the first increase in solar’s levelised cost of electricity (LCOE) in over a decade. That, however, does not pose a challenge to cost competitiveness; solar PV remains significantly cheaper than new fossil fuels and nuclear, and product prices already began to decline in recent months and are largely expected to return to pre-crisis levels soon.
Record installations in 2022 were driven by a remarkable performance in China, the undisputed world-leading solar market, with almost 100 GW added in a single year and a huge 72% annual growth rate. The US experienced a turbulent year in 2022, but kept its spot as the second largest market despite a 6% annual decrease to 21.9 GW, while India’s rebound continued in 2022, with 17.4 GW of new installed capacity and a 23% growth. Closing the 2022 top 5 countries, Brazil doubled its installation rate with 10.9 GW, while Spain became the largest European market with 8.4 GW. At the regional level, China’s dominance increased the Asia-Pacific share to 60%, while Europe remained stable at 19% and the Americas declined to 17%. In terms of installed solar capacity per capita, Australia remains in the lead with almost 1.2 kW/capita, while the Netherlands also crossed the kW/capita threshold, compared to a global average of an estimated 144 W/capita.
Graph 4. Annual solar PV installed capacity 2000-2022
All solar analysts are confident that, following an exceptional 2022, there is no question that strong growth will continue in 2023 – the question is rather how much. Our Medium Scenario anticipates that 341 GW of new solar capacity will be installed worldwide in 2023, equivalent to a 43% growth that basically repeats the extraordinary performance of 2022. With improved market conditions, however, installations could go above 400 GW already in 2023. Solar deployment is expected to continue in the following four years, with 401 GW added in 2024 and a 617 GW market reached in 2027. This will bring total operating capacities above 2 TW in early 2025 and 3.5 TW by the end of 2027.
The strong expansion of 2022 delivered a record number of largely ‘developed’ solar markets. The number of GW-scale solar markets – countries installing at least 1 GW – jumped from 17 in 2021 to 26 in 2022. We forecast 32 GW-scale markets in 2023, 39 in 2024, and at least 53 in 2025.
This year’s regional focus is on Southeast Asia. With the support of the Global Solar Council (GSC), we have provided an in-depth analysis of PV deployment in the region, which holds significant solar potential. We expect the regional market to grow to 3.8 GW this year, up 13% from 2022, and expand to 13.3 GW by 2027 under a Medium Scenario. Another feature is on corporate PPAs in emerging countries, examining the drivers and challenges corporates face in Sub-Saharan Africa and South-East Asia. There are a few promising initiatives for corporate solar PPAs, but in most countries policy frameworks need to be established to tap the gigantic potential of bilateral solar power purchase agreements.
***********
This is the end of the introduction to this report, so please take a look at the more detailed data and analysis in the main body of the report.