PV column
Photovoltaic
2023/05/01
Trends in the number of new housing construction and the residential PV system in Japan
We will introduce the 10-year trend of residential PV system from April 2012 to March 2022, which is attracting attention due to the “mandatory installation of PV system for new buildings” announced by the Tokyo Metropolitan Government in 2022, along with the number of new residential construction starts.
Trends in the number of PV installations and installed capacity for each fiscal year are from the database of the Agency for Natural Resources and Energy, Ministry of Economy, Trade and Industry, from the end of March 2018 to the end of March 2022 (Renewable Energy Project Plan Approval Information (fit-portal.go.jp)), from the end of March 2013 to the end of March 2017 (Publication of various data (past publications) (meti.go.jp)) data. The following data was compiled from the data of the “Housing Starts Statistics” of the Government Statistics (Statistics on Housing Starts | File | Find Statistical Data | Comprehensive Contact Information of Government Statistics (e-stat.go.jp)).
Table 1: Residential PV Installations and New Housing Starts (April 2012 – March 2022)
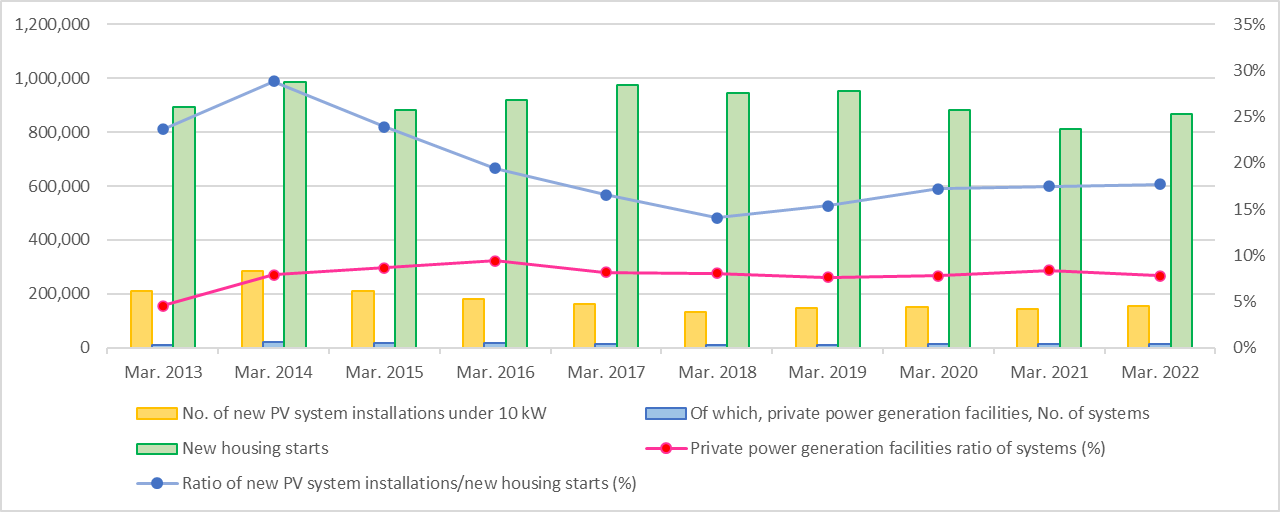
Table 2: Residential PV Installed Capacity (April 2012 – March 2022)
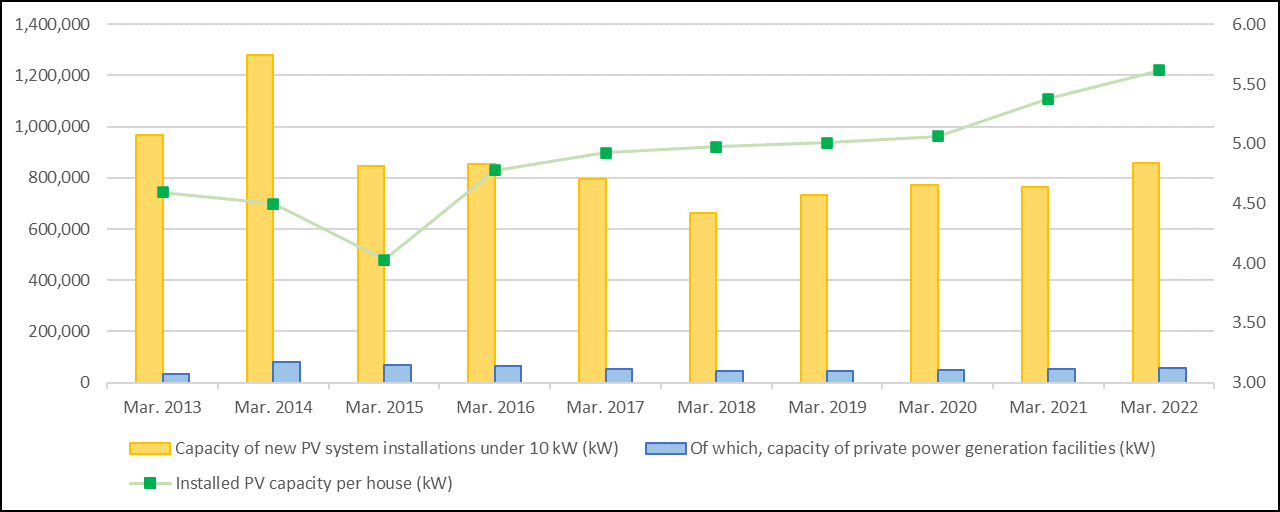
It can be seen that over the past 10 years, the installed PV capacity per home has increased from 4.59 kW to 5.61 kW, benefiting from the improved performance of PV modules. On the other hand, the number of new housing starts and the number of PV installations have remained flat, and the increase in residential PV installations after 2018, as in Germany (PV and Energy Storage System installations in Germany (2022) | European Solar Innovation Corporation (e-solar.co .jp)) cannot be seen in Japan.
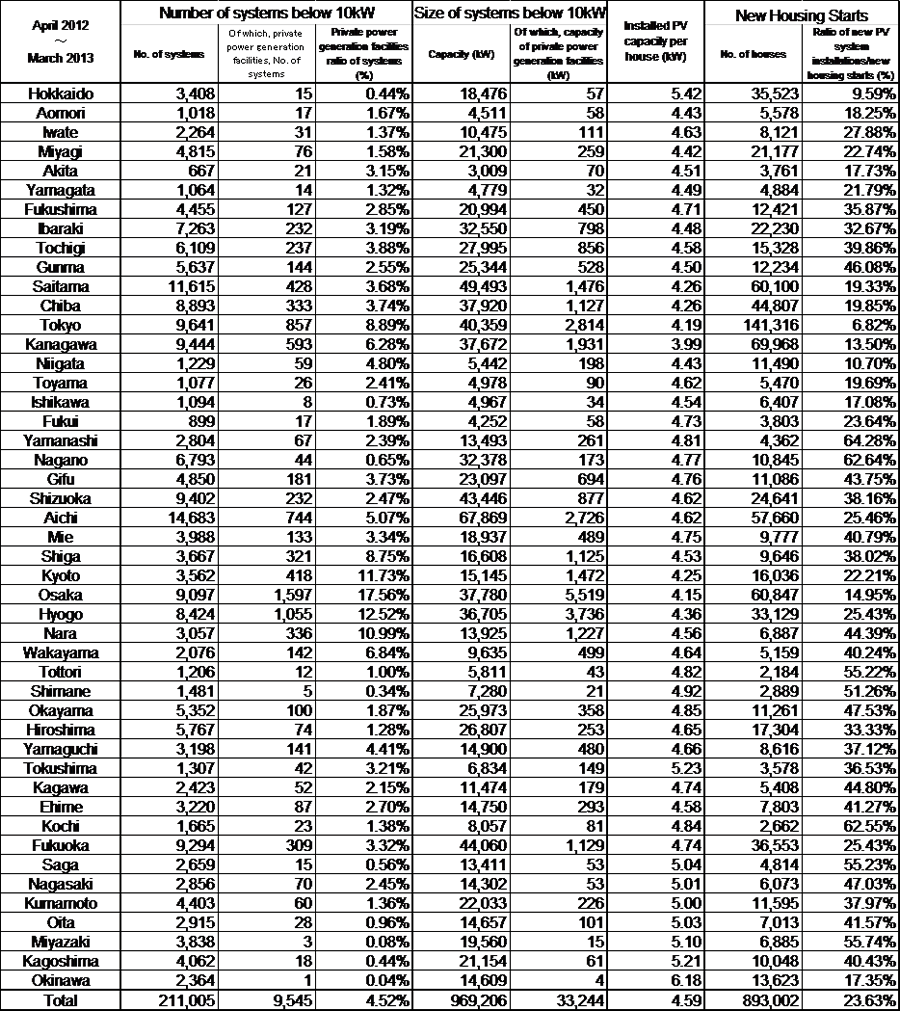
The figures for the one-year period from April 2012 to March 2013 are as follows:
- No. of new PV system installations under 10 kW: 211,005
- Capacity of new PV system installations under 10 kW: 969,206 kW (4.59 kW per house)
- New housing starts: 893,002
- Ratio of new PV system installations/new housing starts: 23.63%
The figures for PV system installation in existing houses are also included in this report, but we have compared and verified the number of homes with the number of PV system installations.
Table 3: Data by Prefecture (April 2012 – March 2013)
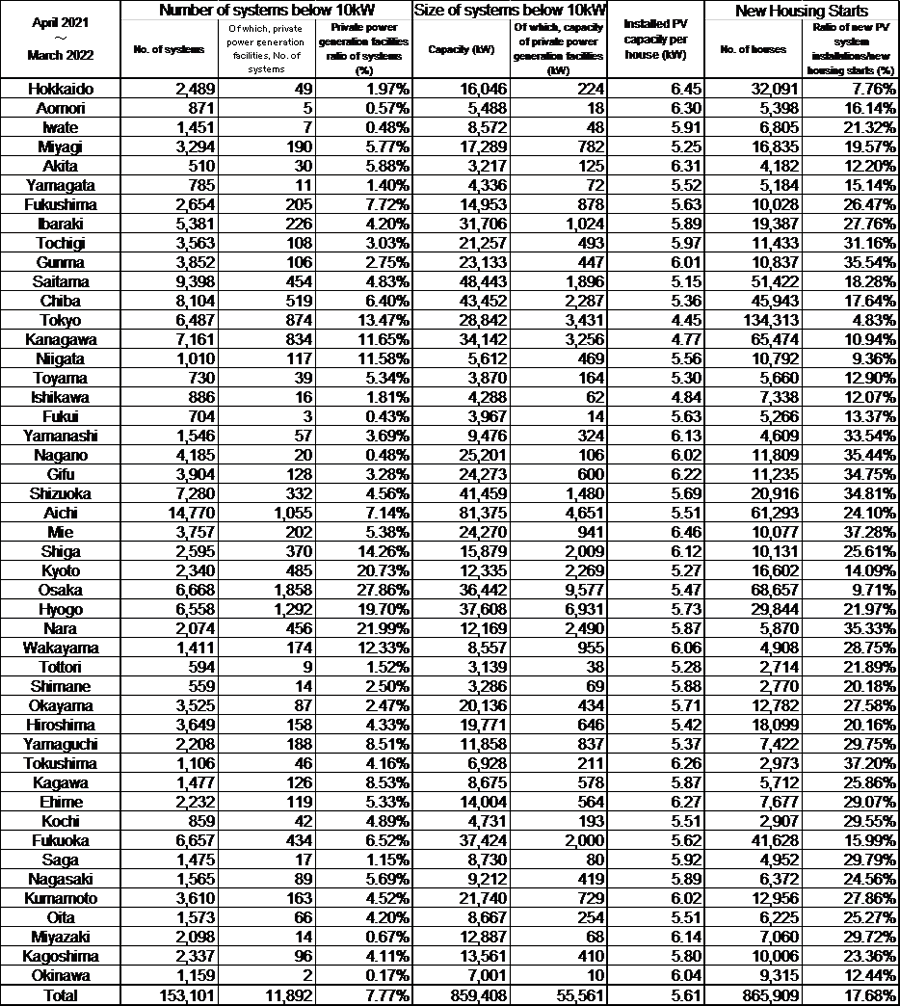
The figures for the most recent year, from April 2021 to March 2022, are as follows:
- No. of new PV system installations under 10 kW: 153,101
- Capacity of new PV system installations under 10 kW: 859,408 kW (5.61 kW per house)
- New housing starts: 859,408
- Ratio of new PV system installations/new housing starts: 17.68%
Table 4: Data by Prefecture (April 2021 – March 2022)
The figures for the 10-year period from April 2012 to March 2022 are as follows:
- No. of new PV system installations under 10 kW: 1,772,893
- Capacity of new PV system installations under 10 kW: 8,534,484 kW (4.81 kW per house)
- New housing starts: 9,116,492
- Ratio of new PV system installations/new housing starts: 19.45%
- Prefectures with an PV installation ratio of 30% or more as follows:
Fukushima, Ibaraki, Tochigi, Gunma, Yamanashi, Nagano, Gifu, Shizuoka, Mie, Shiga, Nara, Wakayama, Tottori, Okayama, Yamaguchi, Ehime, Kochi, Saga, Nagasaki, Oita, Miyazaki, Kagoshima
Prefectures with an PV installation ratio of 10% or less as follows:
Hokkaido (7.77%), Tokyo (4.95%), Okinawa (6.99%)
It will be interesting to see the effect of the mandate announced for 2022 in Tokyo, where the PV installation ratio has been low for the past 10 years.