PV column
Photovoltaic
2022/05/01
Sunshine hours and total solar radiation data for various regions of Japan
The following is an example of the calculation formula introduced by the Japan Photovoltaic Energy Association (JPEA), which is the most commonly used annual estimated amount of PV simulation in the Japanese photovoltaic industry.
Esys(year) = Σ(Kh x Kpcs x Kj x Elight)
Esys: Estimated annual power generation per unit capacity [kWh]
Kh: Correction coefficients (temperature and other correction coefficients, etc.)
Kpcs: PV inverter conversion efficiency
Kj: Other loss coefficients (dirt on module surface/wiring/circuit loss figures, etc.)
Elight: Solar radiation for each month [kWh/m2 ] (January-December)
Source: JPEA labeling guidelines
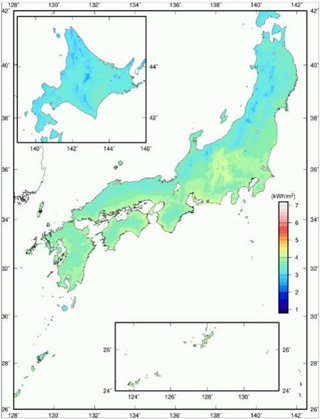
MONSOLA 11, the recommended data for solar radiation (Elight) used here, is available at the New Energy and Industrial Technology Development Organization (NEDO), a national research and development corporation. This annual monthly solar radiation database (MONSOLA 11) is a database of irradiation averaged over 29 years (1981-2009) at 837 sites in Japan.
Source: NEDO
NEDO has released MONSOLA20 and METPV20 as updated versions of MONSOLA11 and METPV11 on its website. (Statistical period: 2010-2018.)
Source/Link: https://appww2.infoc.nedo.go.jp/appww/index.html
On the other hand, as a human sense, weather and sunshine hours may be easier to image than solar radiation. The following two types of data related to sunlight (sunshine hours and total solar radiation) for each month are compiled from the database at the Japan Meteorological Agency.
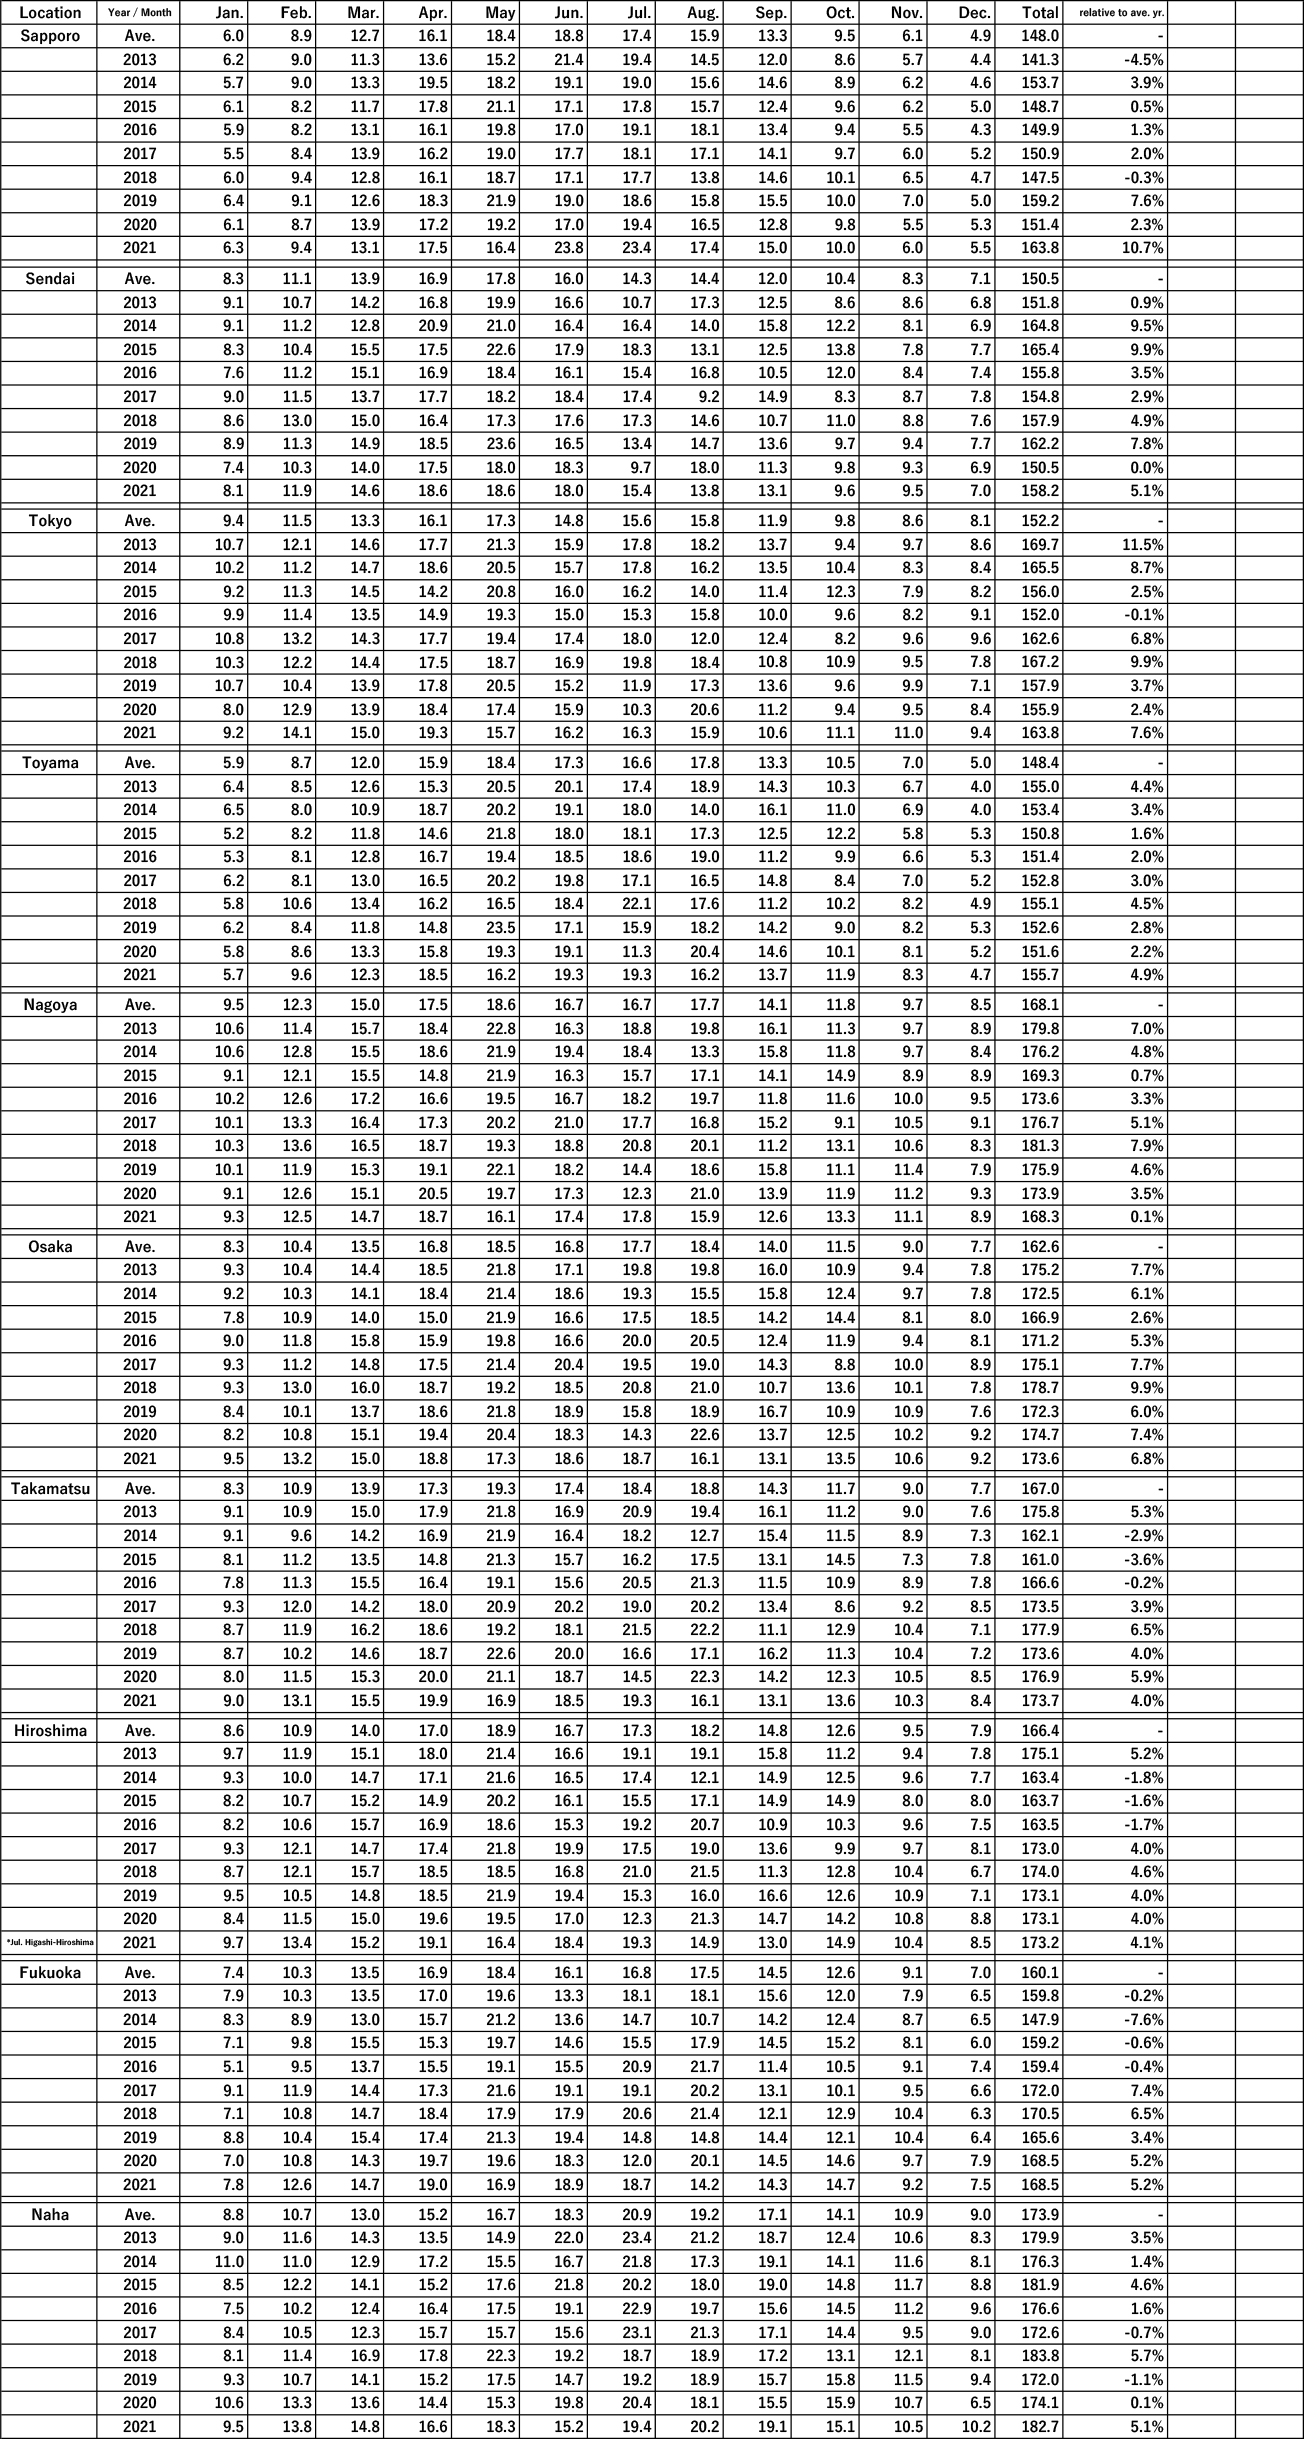
(1) Sunlight hours data (unit: hours)
Data source: Downloaded from JMA historical weather data and edited by our company
Selection: 10 locations nationwide (Sapporo, Sendai, Tokyo, Toyama, Nagoya, Osaka, Takamatsu, Hiroshima, Fukuoka, Naha)
Comparing the average sunshine hours over the past 30 years and the last 9 years from 2013 to 2021, the sunshine hours in the last 9 years are (+4.3%) longer than in the average year. The shortest compared to the average year was Hiroshima in 2016 (-6.7% compared to the average year), and the longest was Sapporo in 2021 (+19.3% compared to the average year).
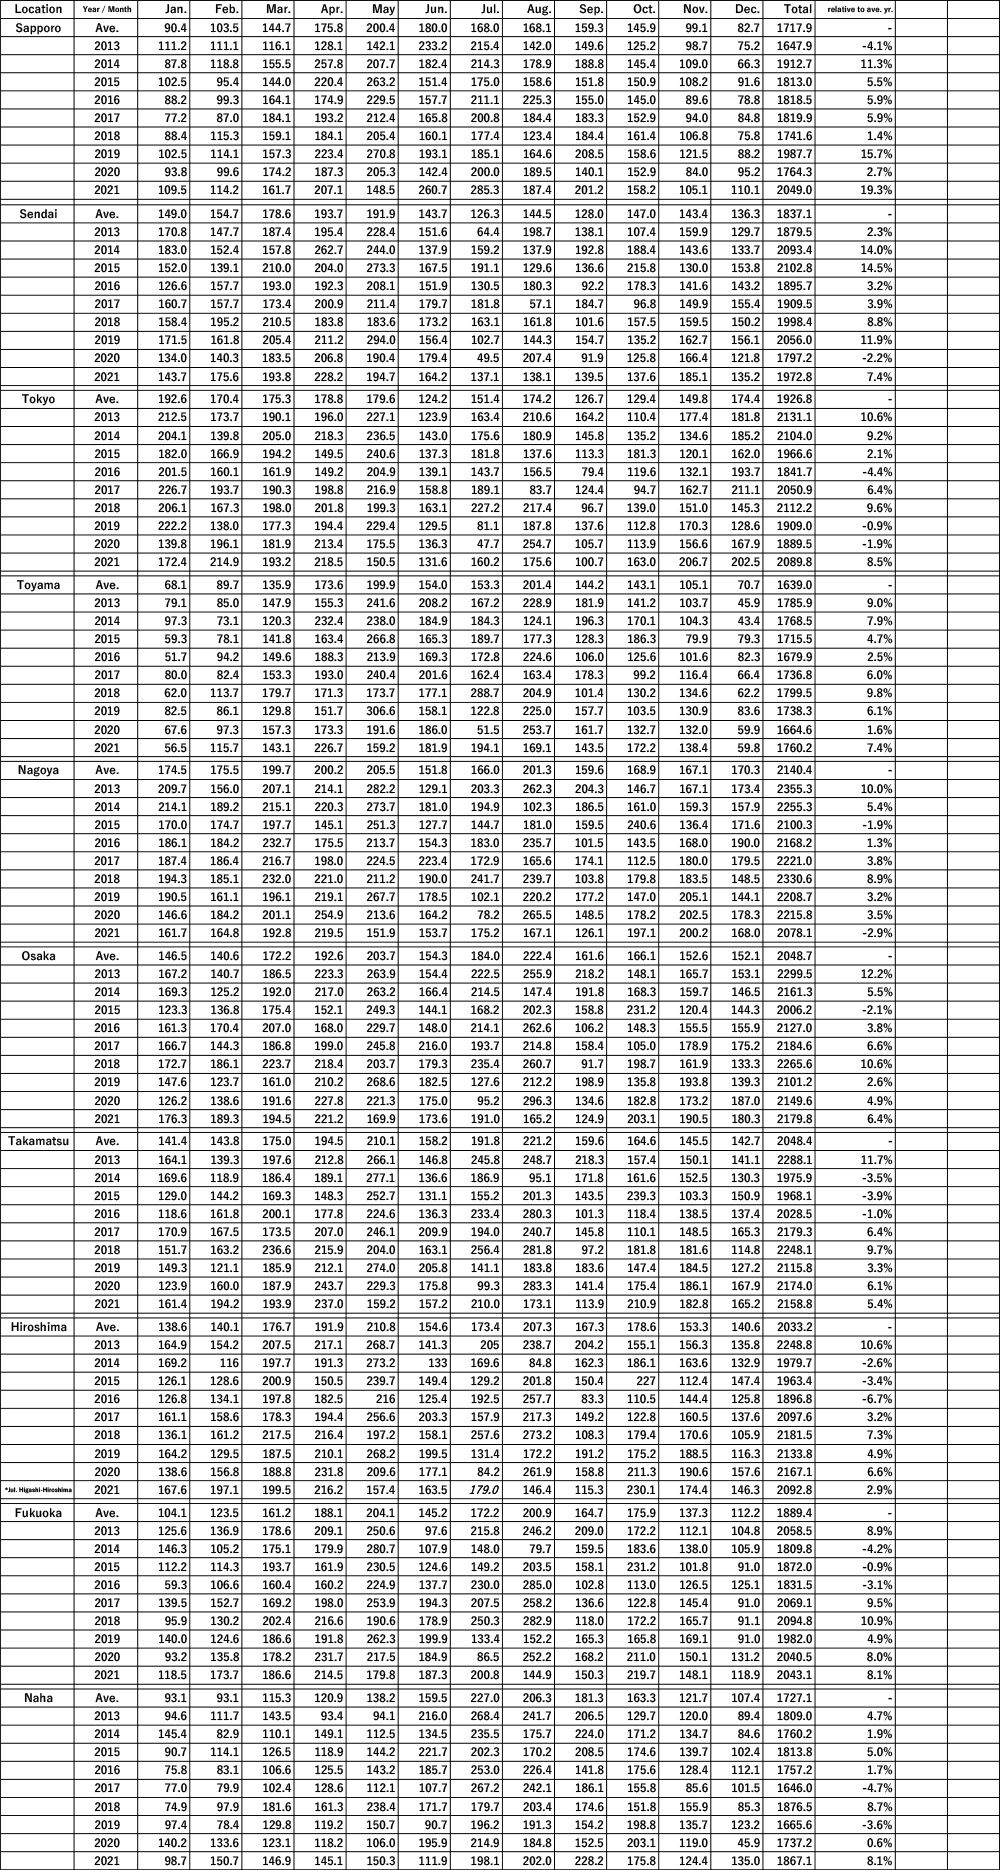
(2) Global solar radiation data (unit: MJ/m2)
Data source: Downloaded from JMA historical weather data and edited by our company
Selection: 10 locations nationwide (Sapporo, Sendai, Tokyo, Toyama, Nagoya, Osaka, Takamatsu, Hiroshima, Fukuoka, Naha)
Comparing the average data for the past 30 years and the last 9 years from 2013 to 2021, the total solar radiation increased (+3.6%) in the last 9 years, showing some correlation with the sunshine hours (+4.3%). The lowest compared to the average year was in 2014 Fukuoka (-7.6% of normal), with 2014 Fukuoka having (-4.2% of normal) sunshine hours and 2016 Hiroshima (-6.7% of normal) having the lowest total solar radiation compared to the average year (-1.7% of normal). The highest total solar radiation compared to the average year was observed in Sapporo in 2021 (10.7% of normal), which is the same result as the sunshine data (+19.3% of normal).
Although the causal relationship with global warming is not clear, the average annual power generation from PV system is expected to be about 4% higher than in general PV simulations.
Source: Photovoltaic Energy Association (JPEA) Labeling Guidelines
Source: Japan Meteorological Agency Historical Weather Data Download
Source: New Energy and Industrial Technology Development Organization (NEDO) database (https://www.nedo.go.jp/library/nissharyou.html, https://appww2.infoc.nedo.go.jp/appww/index.html)