PV column
consulting
2022/03/11
Domestic solar power generation estimation and simulation results
Generally, the evaluation of photovoltaic power plants is performed in advance based on the results of power generation simulation. There are various solar radiation data and calculation methods for power generation simulation, but in Japan, simulations that utilize the solar radiation data of MONSOLA-11 from the New Energy and Industrial Technology Development Organization (NEDO) database are widespread. increase.
Based on this MONSOLA-11 solar radiation data, facing south (azimuth 0 degrees), panel installation angle (tilt angle) 15 degrees, system efficiency 97%, power conditioner (PCS) conversion efficiency 95%, module first The following estimation is made with an annual deterioration rate of 2% and an aged deterioration rate of 0.5%.
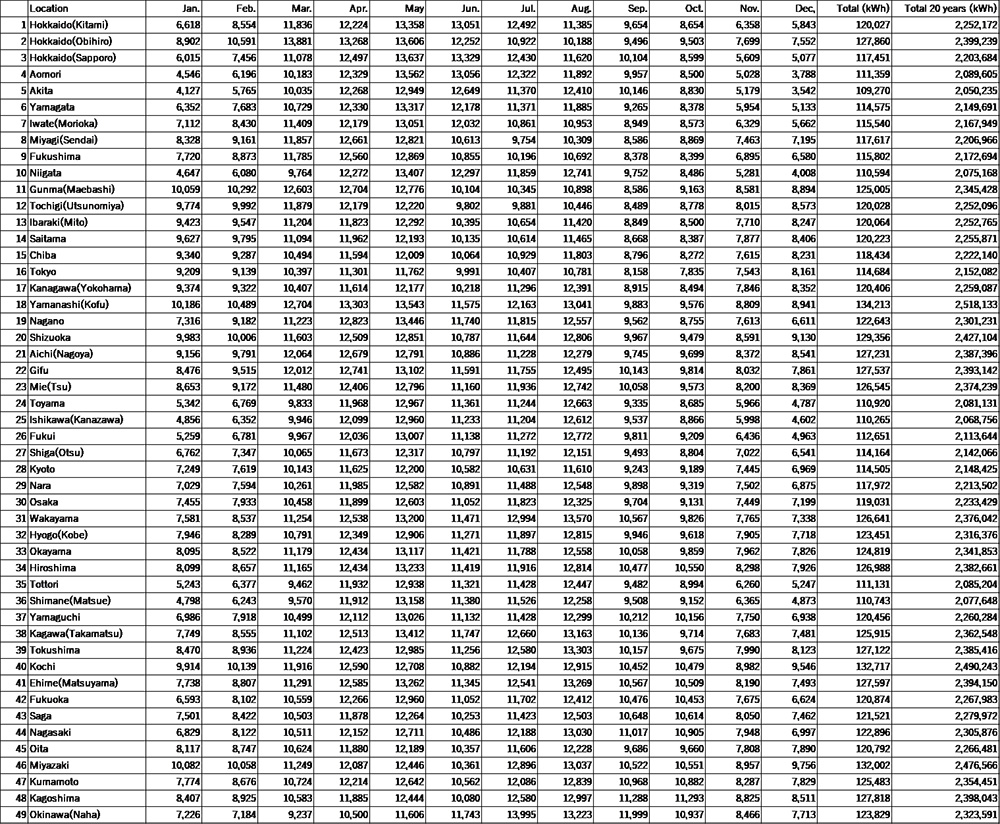
- Power generation with a module capacity of 100 kW and a PCS capacity of 100 kW at 49 locations nationwide (3 locations in Hokkaido and the locations of other prefectures).
- At 10 locations nationwide (Sapporo, Sendai, Tokyo, Toyama, Nagoya, Osaka, Takamatsu, Hiroshima, Fukuoka, Naha), the module capacity is 250kW, and the PCS capacity is 250kW, 200kW, 150kW, and 100kW. The power generation peak cut calculation based on the PCS rated output is a correction calculation (24 hours, 365 days) of the METPV-11 data of the NEDO database according to the power generation simulation result of MONSOLA-11, and the module is deteriorated in the first year and aged. Also reflected.
(Power generation simulation ①)
Photovoltaic power plant capacity 100kW (both module capacity and PCS capacity 100kW), facing south (direction angle 0 degrees), panel installation angle (tilt angle) 15 degrees, system efficiency 97%, PCS conversion efficiency 95%, module first year deterioration Estimated “monthly power generation, annual power generation, 20-year power generation” under the conditions of a rate of 2% and an aged deterioration rate of 0.5%.
(Power generation simulation ②)
Photovoltaic power plant capacity 250kW (module capacity), PCS capacity 4 ways: a. 250kW, b. 200kW, c. 150kW, d. 100kW, facing south (azimuth 0 degrees), panel installation angle (tilt angle) 15 Estimated “monthly power generation, annual power generation, 20-year power generation” under the conditions of system efficiency 97%, PCS conversion efficiency 95%, module first year deterioration rate 2%, and aging deterioration rate 0.5%.
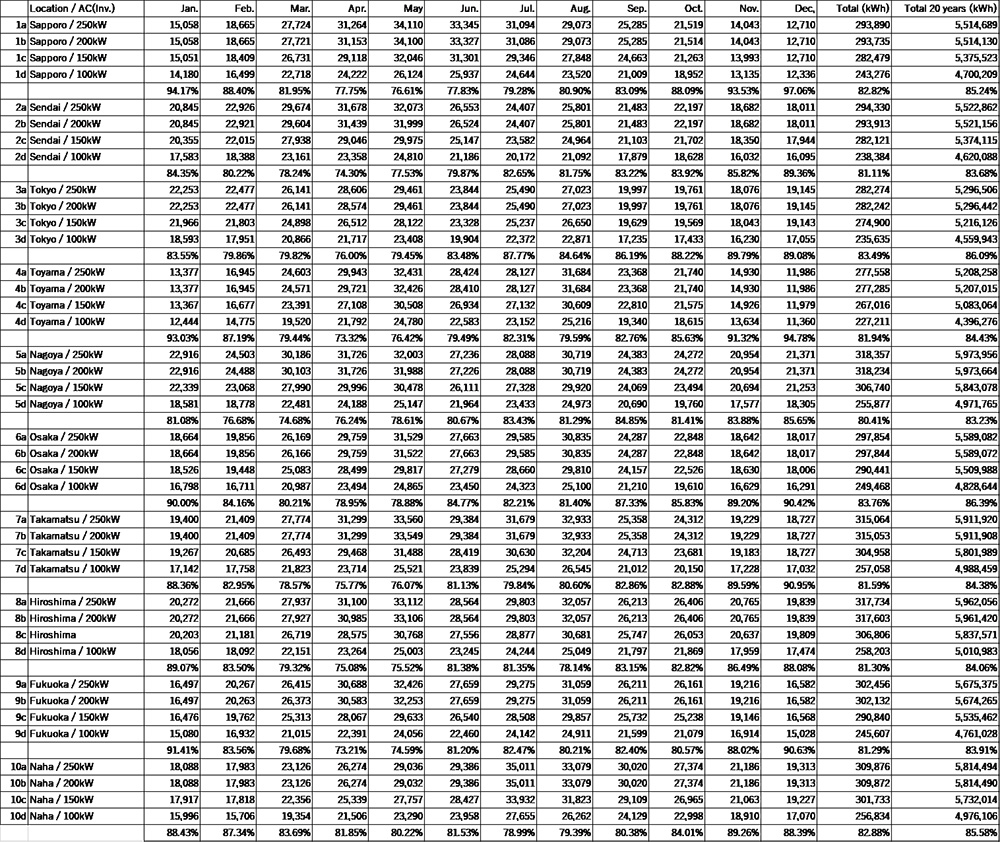
The difference in power generation amount depending on the ratio of module and PCS capacity (DC: AC ratio) is almost the same between 1: 1 (250kW: 250kW) and 1: 0.8 (250kW: 200kW), and 1: 0.8 (250kW: 200kW). ) And 1: 0.6 (250kW: 150kW), the difference in total power generation over 20 years is 97.34 ~ 98.59%, which is almost the same estimation result.
In the case of 1: 0.4 (250kW: 100kW), the difference in total power generation for 20 years from 1: 0.8 (250kW: 200kW) is calculated by 83.23 to 86.39%.
Source: New Energy and Industrial Technology Development Organization NEDO Database
https://www.nedo.go.jp/library/shiryou_database.html
Source: Simulation by our PV cloud service
https://app.e-solar.co.jp/pg_simulation