PV column
Photovoltaic
2025/05/12
“Global Market Outlook for Solar Power 2025-2029” by SolarPower Europe
To learn more about the global solar market and its trends over the next five years, SolarPower Europe has published this year’s edition of “Global Market Outlook for Solar Power 2025-2029.” The market trend of solar power generation is very clearly summarized.

Source: https://www.solarpowereurope.org/insights/outlooks/global-market-outlook-for-solar-power-2025-2029
This column provides an introduction and executive summary of this report.
************
00 Foreword
Introduction
Welcome to the Global Market Outlook for Solar Power 2025-2029
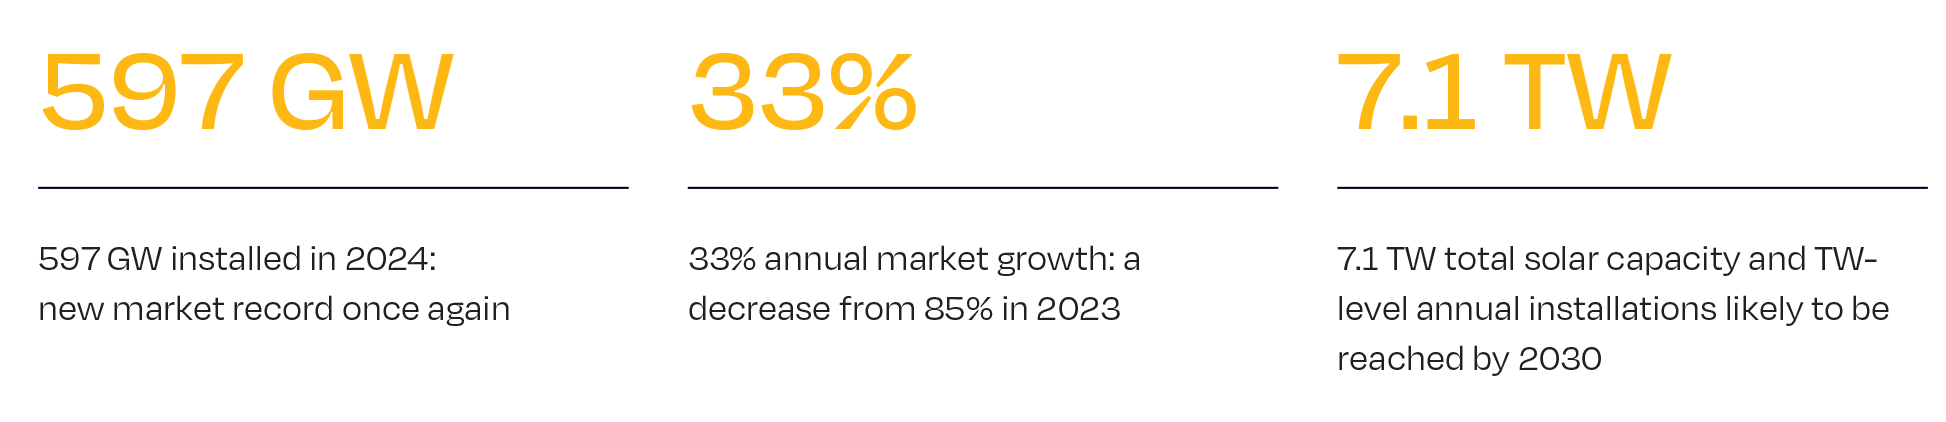
The year 2024 was a true landmark year for solar power. Global solar installations reached nearly 600 GW – an impressive 33% increase over the previous year – setting yet another record. Solar accounted for 81% of all new renewable energy capacity added worldwide. While remaining a modest contributor to overall electricity generation for now, solar’s share rose to 7% in 2024 – nearly doubling in just three years. Solar experienced the fastest growth among all power generation technologies in terms of electricity output, three times as much as wind power, which was ranked second. As if that weren’t enough, global installed solar capacity surpassed 2 TW in 2024. It took nearly 70 years to reach the first terawatt, but only two more to double it.
This remarkable progress has been fuelled by rapid technological advancements that have significantly reduced costs, the unmatched versatility of solar – from small plug-in or rooftop systems to massive utility-scale installations – and historically low prices driven by global manufacturing overcapacities. As a result, solar is increasingly outperforming other power generation technologies across the board.
There is no doubt that solar power has become the driving force of the global energy transition
Looking ahead, however, there remain challenges that must be addressed for solar to continue fulfilling its potential. Although continued market growth is expected, the pace is projected to slow after several years of explosive expansion. In our most realistic scenario, we anticipate a 10% increase in installations to 655 GW in 2025, with annual growth rates remaining in the low double digits between 2027-2029, reaching 930 GW by the end of this outlook period. However, meeting the Global Solar Council’s aspirational target of 8 TW by 2030 will require a significantly accelerated pace of deployment – roughly 1 TW of new installations per year on average.
A key issue is the uneven distribution of solar market growth. Most expansion has been concentrated in the Asia-Pacific region, led by China, creating widening disparities between regions. In 2024, China’s solar market grew by 30% to 329 GW, more than the combined total of the other top 10 markets, with a 55% global market share. China’s growth is a major achievement from a global decarbonisation perspective and its comprehensive solar commitment has enabled the technology’s rapid global development, but it also underscores the world’s heavy reliance on a single country. With China implementing major changes to its solar market design this year, a temporary dip in global growth in 2026 appears very likely. Meanwhile, other regions are falling behind, particularly the Middle East and Africa, which installed less capacity than in the previous year. Although the number of countries with annual gigawatt-scale solar markets has increased to 35, this is fewer than anticipated. We do expect this to change in the near future; our report provides a detailed analysis of these GW-scale markets, with insights from national solar and renewable energy associations (see p. 78).
There are also rising solar stars today. India’s comprehensive solar strategy – covered in a dedicated chapter (see p. 60) – is beginning to bear fruit. The most populous nation on Earth has emerged as the world’s third-largest solar market after more than doubling its annual installations in 2024. Continued strong growth is expected.
As outlined in the Global Solar Council’s policy recommendations (see p. 56), sustaining global momentum will require addressing a range of region-specific challenges. More advanced markets must focus on enhancing grid flexibility, adapting policy frameworks to the needs of variable renewables, prioritising battery storage, and streamlining permitting and grid-connection processes. For least developed countries, the key lies in bridging investment gaps. Across all regions, developing a skilled workforce and setting ambitious solar and storage targets are essential tasks.
In these times of political uncertainty, low-cost solar power could turn into the key tool to provide energy security and competitiveness to nations across the world. The years ahead are crucial for solar development and will require foresight and commitment from policy leaders and financial institutions. In our most likely Medium Scenario, we expect solar’s role in the driver seat of the global energy transition to become even stronger, reaching a total installed capacity of 7.1 TW by 2030 – and delivering nearly two-thirds of the 11 TW renewable energy target set at COP28. With the right enabling conditions, solar capacity could even quadruple its capacity and exceed 8 TW by the end of the decade.
Enjoy reading our report.
************
01 Executive summary
Introduction
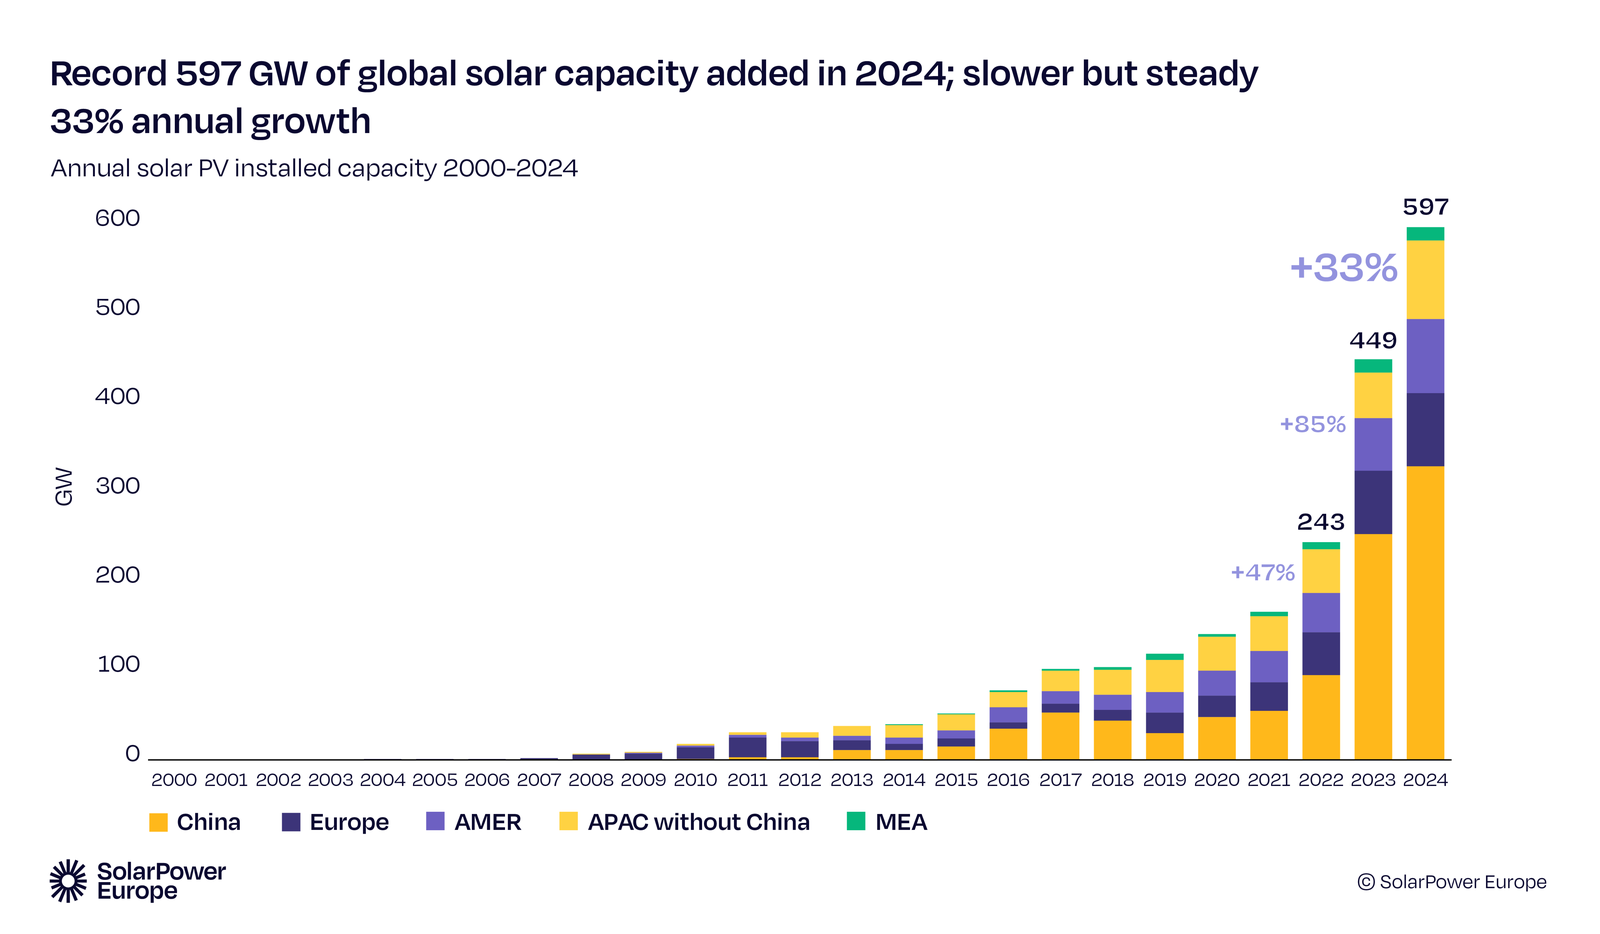
The global solar market reached new heights with about 600 GW in 2024, with Asia-Pacific providing 70% of new capacity
Global solar PV installations set another record in 2024, reaching 597 GW – a 33% increase over 2023, and 148 GW more the previous year (Fig. 1). Although the annual growth rate slowed compared to the exceptional 85% surge in 2023, it was still substantial enough to reinforce solar energy’s leading dominance on global renewable energy expansion. In 2024, solar contributed 81% of all new renewable capacity added worldwide. Regarding global power generation, solar nearly doubled its share over the past 3 years, growing by 1.3 percentage points only last year to a 7% share in the world’s electricity mix. This growth continued to drive renewable penetration and pushed additions of conventional electricity sources to a new low.
FIGURE 1.
Several factors contributed to this sustained momentum. Technology improvements that have turned versatile solar into the lowest-cost power generation technology in many places around the world, along with record-low solar component prices – largely due to significant manufacturing overcapacity along the solar value chain – have made solar products more affordable than ever. At the same time, solar PV is increasingly being recognised as a cornerstone technology in climate, political, and energy security strategies worldwide.
The Asia-Pacific region remained the undisputed regional leader, accounting for 70% of global capacity additions and a 37% annual growth. The Americas also increased by 40% to a 14% market share. Europe also saw growth, albeit at a slower pace, rising by 15% to 82.1 GW, with a 14% market share. Conversely, the Middle East and Africa was the only region to experience a year-on-year decline in 2024, decreasing 2% to 14.5 GW and accounting for 2.4% of the global market.
China continues to play in a different league, outperforming other top 10 markets with new stars on the horizon
In 2024, China once again dominated the global solar market, installing an impressive 329 GW, over six times the capacity added by the second-ranked United States, and exceeding the combined total of all other top 10 markets. This accounted for 55% of global additions, further solidifying China’s position as the outstanding leader in solar PV deployment (Fig. 2).
FIGURE 2

Despite China’s overwhelming lead, most of the other top 10 markets also recorded strong growth. The US added a record 50 GW, representing a 54% increase. India experienced a remarkable rebound, surging by 145% to 30.7 GW, reclaiming third place after slipping to fifth in 2023. India’s strong resurgence pushed Brazil and Germany each down one position in the rankings, with annual installations of 18.9 GW and 17.4 GW, respectively.
Two countries entered the global top 10 in 2024. Türkiye made a strong leap to the seventh place, with a five-fold increase in annual installations, reaching 8.5 GW. France entered the top 10 at the tenth position, growing by 49% to 4.7 GW. These additions displaced Australia and the Netherlands from the top 10.
Spain, Italy and Japan completed the ranking at 6th, 8th and 9th place, with installations of 8.7 GW, 6.8 GW and 6.2 GW, respectively. Altogether, the top 10 markets were responsible for 81% of global solar PV installations, while the rest of the world accounted for the remaining 19%, collectively installing 116 GW. Clearly this imbalance in the market and global distribution needs to be addressed by investors and policymakers moving forward – all G20 countries, and developing countries too, should be seeing similar solar booms.
It took nearly 70 years to install the first solar TW, and only 2 years (2022-2024), to double the solar fleet to 2 TW
The pace of solar PV deployment in recent years has been unprecedented. While it took nearly 70 years – from the first commercialisation of solar cells in 1954 – to reach the first 1,000 GW (1 TW) of capacity, the second TW was added in just two years. With 449 GW installed in 2023 and 597 GW in 2024, global cumulative installed solar PV capacity reached 2.2 TW by the end of 2024 (see Fig. 3). The solar industry was able to celebrate this milestone at COP29 Baku in Azerbaijan.
FIGURE 3

dominating the global landscape. The region holds 1.4 TW, equivalent to a 63% global share. Within APAC, China alone accounts for approximately 1 TW of grid-connected solar, increasing its global capacity to 44%.
In terms of solar capacity per person, three countries – Australia, the Netherlands, and Germany – have surpassed the milestone of 1 kW per inhabitant. While the global average stands at 276 W/capita, Europe remains the region with the highest per capita solar installation ratio at 480 W, despite its recent market stagnation.
Global solar PV growth expected to slow to 10% in 2025, reaching 655 GW new installations
2025 will mark a pivotal year for the global PV industry. Structural solar growth continues to be fuelled by China and solar’s unmatched competitiveness due to its record low prices, unique versatility, and further decreasing cost. At the same time, external pressures are mounting – from resurging political support for fossil fuels and macroeconomic headwinds to shifting geopolitical dynamics –, all of which is introducing a higher degree of market uncertainty, with market performance likely to diverge sharply based on how these risks evolve.
As solar’s growth continues, though at slower speed, the urgent need for energy system flexibility solutions is quickly mounting. Policymakers and regulators have constantly underestimated the pace of solar development, leading to underinvestment in grid infrastructure and outdated networks. This misalignment is already resulting in major system challenges in more advanced markets, such as rising curtailment rates and more frequent instances of negative electricity prices, which in turn reduce solar capture prices, threatening the economic viability of new solar projects. It is critical that regulators in markets all over the world, both mature and nascent PV and storage markets, plan for the necessary system flexibility in order to solve these challenges before they occur.
Despite these headwinds, the global solar PV market is still expected to grow by 10% in 2025, reaching 655 GW under the Medium Scenario (see Fig. 4). This would mark a continuation of the deceleration trend following the extraordinary 85% growth in 2023 and the more moderate 33% in 2024. However, this trajectory is not without risk as policy changes in the two largest markets, China and the US, may further temper growth. In the EU failure to implement effective policy frameworks at the member state levels could even trigger market contraction. Under our Low Scenario, worsening market conditions could lead to an 8% decline in annual installations to 548 GW. In contrast, our High Scenario forecasts a 30% surge to 774 GW, driven by sustained low product prices and potential policy stimulus in China.
FIGURE 4

Double-digit growth rates as of 2027 set the stage for an annual TW-scale market by 2030
Looking ahead, the global solar market is projected to continue its upward trajectory through 2029, though not without some volatility. While long-term fundamentals – including continued low prices, largely based on further declining costs, cross-sectoral electrification, and strong energy security priorities – will support growing demand. But short-term uncertainties, particular around China’s evolving policy framework, could cause temporary slowdowns.
A short-lived stagnation in global PV installation growth is expected in 2026, as China adjusts to implementing its new solar market design. This market correction will be followed by double-digit growth resuming from 2027 onward.
By 2029, annual global solar installations are projected to reach 930 GW in the Medium Scenario, and could surpass 1.2 TW in the High Scenario. If growth continues on this path by the end of the decade, a global solar market adding 1 TW annually appears within reach by 2030 (see Fig. 5).
FIGURE 5

Total solar capacity set to exceed 7 TW by 2030, increasing the technology’s contribution to the global 11 TW renewable target by 2030
Cumulative solar PV capacity is expected to exceed most energy analysts’ forecasts by 2030. If the solar market trajectory continues as projected, total global solar installations are set to triple over the next five years, surpassing 6 TW by 2029 in the Medium Scenario. By extrapolating this trajectory to 2030, total solar capacity will stand at 7.1 TW by the end of the decade. The Global Solar Council has set an aspirational target of 8 TW of total installed capacity by 2030, which is within our High Scenario projection for that year; however, the Medium Scenario falls behind this target, showing that decision-makers need to fast-track solar deployment in their markets (see Policy Recommendations at p. 56).
Crossing the 7 TW level positions solar PV as the primary driver in meeting the COP28 Dubai goal to triple renewable energy capacity to 11 TW by 2030. Based on our projections, PV will account for about 65% of the renewable capacity needed to achieve the target, up significantly from its 46% share of total renewable capacity in 2024 (see Fig. 6).
FIGURE 6

Download the full Global Market Outlook for Solar Power 2025-2029 here.
This is the end of the introduction to this executive summary report, so please take a look at the more detailed data and analysis in the main body of the report.
Link:
https://www.solarpowereurope.org/insights/outlooks/global-market-outlook-for-solar-power-2025-2029
Acknowledgements: We would like to express our gratitude to SolarPower Europe and all the related parties for publishing comprehensive reports on trends in the photovoltaic market every year.